Each week, MarketFIT™ from Express Freight Finance analyzes real-time freight market data to surface the most favorable and competitive markets across the country.
Rather than reacting to yesterday’s trends or generic load board averages, MarketFIT helps carriers and brokers make smarter decisions in the moment — from where to drive next, to how to price lanes, to when to push for stronger rates.
MarketFIT Platform Overview
With MarketFIT, Express Freight Finance clients gain access to in-depth dashboards covering 125+ U.S. markets and thousands of active freight lanes, all updated continuously to reflect real-world conditions.
If this is your first time here, watch our short overview below featuring Dan Hadley, President & CEO of Express Freight Finance, to see how MarketFIT turns raw data into actionable strategy inside your business.
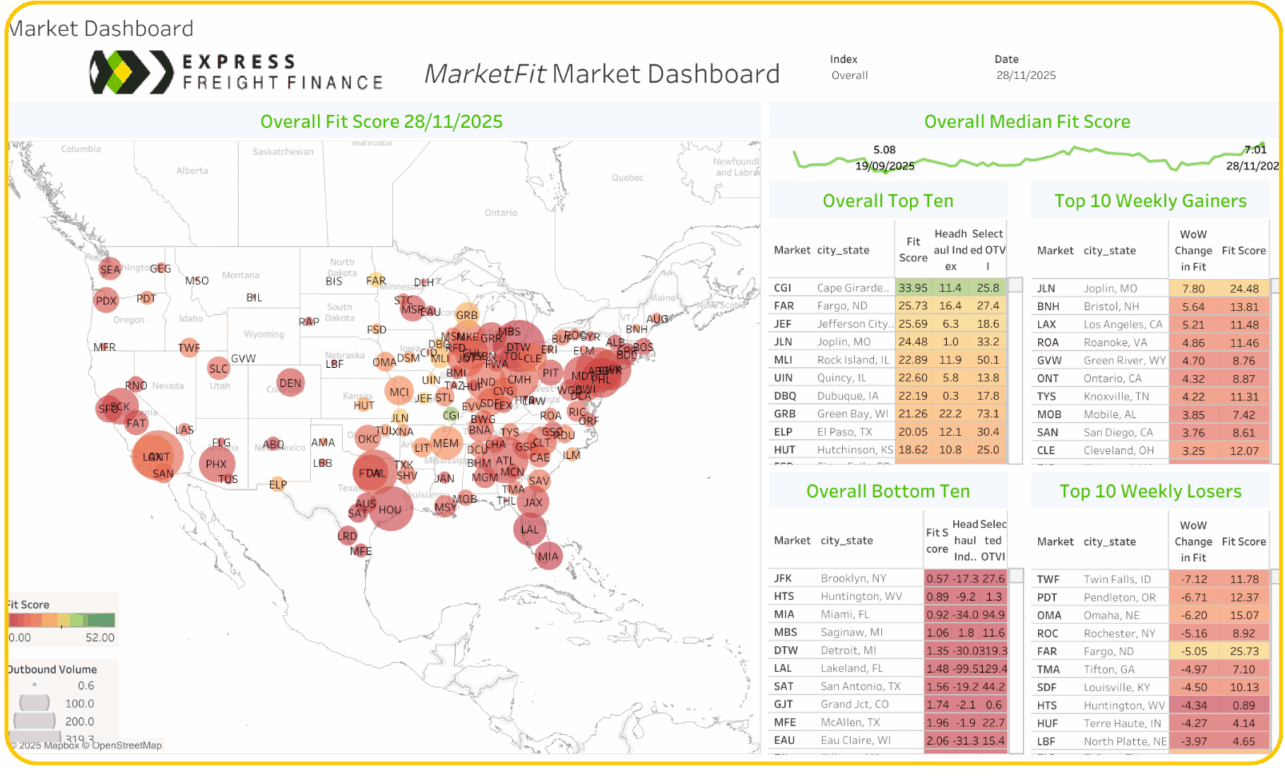
What This Week’s Data Shows
Below is a snapshot of this week’s live MarketFIT data, highlighting key shifts in demand, capacity, and pricing across top U.S. freight markets.
St. Louis, MO posts the strongest weekly rebound nationwide, with the Overall Fit Score climbing by +10.01 points to 22.57, signaling accelerating outbound freight demand and rapidly tightening capacity conditions.
Outbound Tender Volume increased to 78.9, closely outpacing Inbound Tender Volume at 76.1 and producing a Head Haul Index of 2.9. This slight outbound advantage indicates expanding freight availability leaving the market and early signs of tightening capacity as tender activity builds.
The Outbound Tender Reject Index (OTRI) climbed to 22.16, reflecting carriers becoming more selective on contracted freight and increasingly shifting toward spot opportunities. This rise in rejection rates is often associated with improving carrier sentiment and strengthening pricing leverage across the region.
Overall, St. Louis is rebounding sharply from prior softness, showing consistent week-over-week gains. The surge in both Fit Score and rejection rates highlights growing demand and heightened competition for outbound loads. If current trends continue, St. Louis may experience additional tightening through mid-December, creating stronger spot opportunities and signaling a healthier freight environment heading into late Q4.

Carriers Continue To Ramp Up Profits With These Lanes:
- Chicago, IL → Detroit, MI - Avg. Rate per Mile: $3.69
- Columbus, OH → South Bend, IN - Avg. Rate per Mile: $3.60
- Chicago, IL → Cincinnati, OH - Avg. Rate per Mile: $3.49
These lanes continue to show exceptional resilience as Midwest demand remains solid and capacity tightens across key industrial corridors.
Load Availability & Lane Rates Intelligence
Zero in on where freight is actually moving right now — highlighting lanes with rising demand, tightening capacity, and improving rate potential.
Use this MarketFIT data to spot pockets of opportunity as they emerge, compare lanes side by side, and prioritize routes that offer the best balance of volume and pricing — before conditions shift.
Below is a snapshot of this week’s load availability and lane rate data across key markets.