
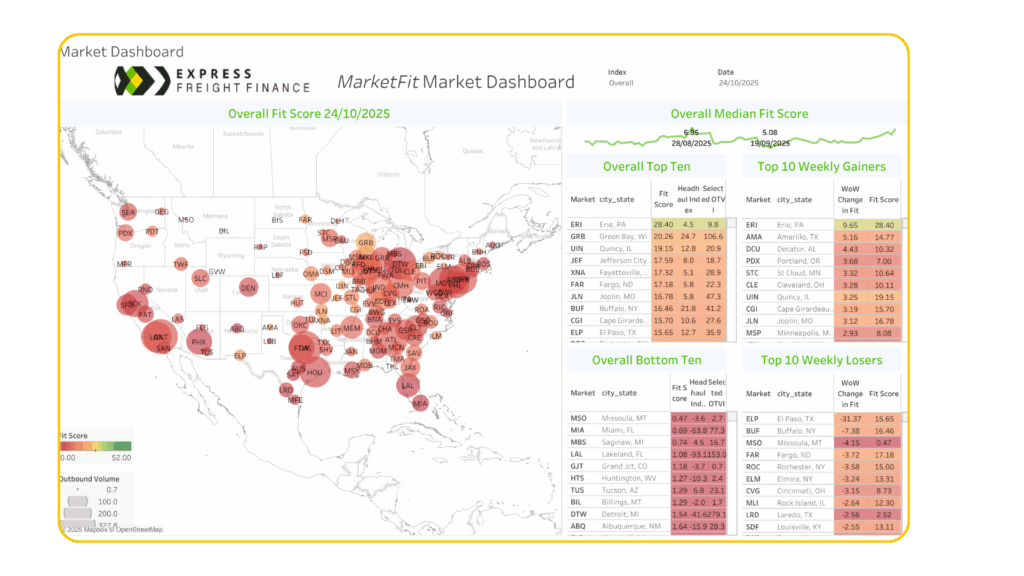
MarketFIT, from Express Freight, is the first tool of its kind that allows carriers to use data to quickly identify the most favorable and competitive freight markets in the US.
All of our clients have access to in-depth dashboards on over 125 markets across the US and countless lanes between these markets.
Now, let’s see a snapshot of live data from this week to give you an upper hand as you plan your routes and negotiate rates. Contact us at 877.697.0605, if you’re interested in getting access to the full platform.
MarketFIT Platform Overview
Here is an overview of the MarketFIT platform provided by Dan Hadley, CEO of Express Freight Finance.
If it’s your first time here, we encourage you to have a watch to see how powerful this data can be when you put it to work inside your business.
Omaha, NE demonstrates a solid upward trend this week, with the Overall Fit Score rising by +6.46 points to 19.37, signaling renewed strength in regional freight movement and improving balance between supply and demand dynamics.
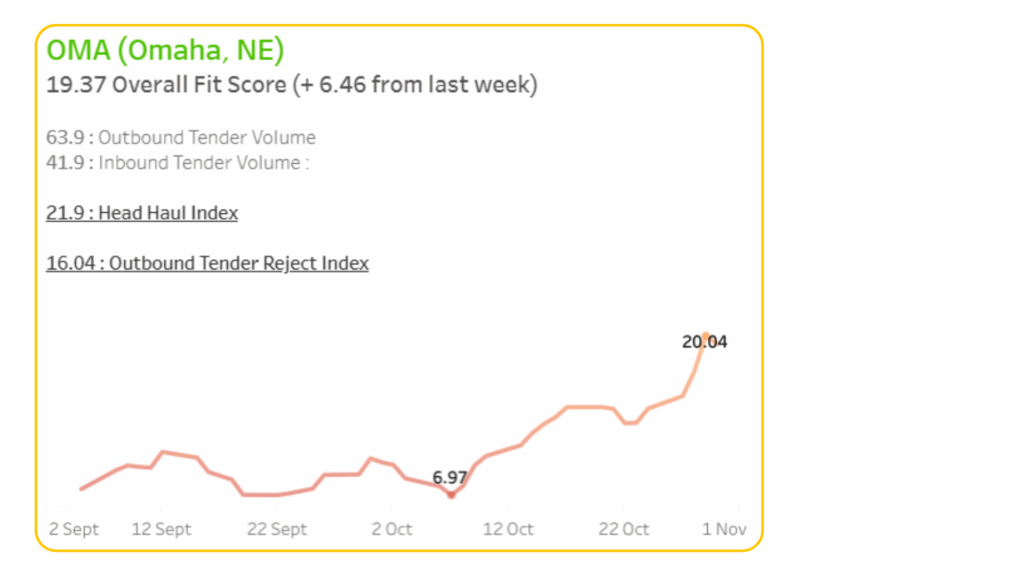
Outbound Tender Volume climbed to 63.9, significantly surpassing Inbound Tender Volume at 41.9, producing a Head Haul Index of 21.9. This wide outbound-to-inbound spread suggests strong outbound shipping demand and tightening truckload capacity as more freight leaves the market than enters it.
The Outbound Tender Reject Index (OTRI) reached 16.04, up notably from early October’s 6.97 low. This increase reflects carriers regaining pricing leverage and becoming more selective on contract loads, often a sign of improving carrier sentiment and early capacity strain.
Overall, Omaha’s freight market is rebounding from previous softness, showing consistent week-over-week gains. The sharp rise in both fit score and rejection rates indicates strengthening demand and growing competition for outbound loads. If current trends persist, Omaha could experience continued tightening through November, enhancing spot market opportunities and signaling a healthier freight environment heading into late Q4.
Carriers Continue To Ramp Up Profits With These Lanes:
- Chicago, IL – Detroit, MI – Avg. Rate per Mile: $3.69
- Charlotte, NC – Lakeland, FL – Avg. Rate per Mile: $2.78
- Ft Worth, TX – McAllen, TX – Avg. Rate per Mile: $2.13
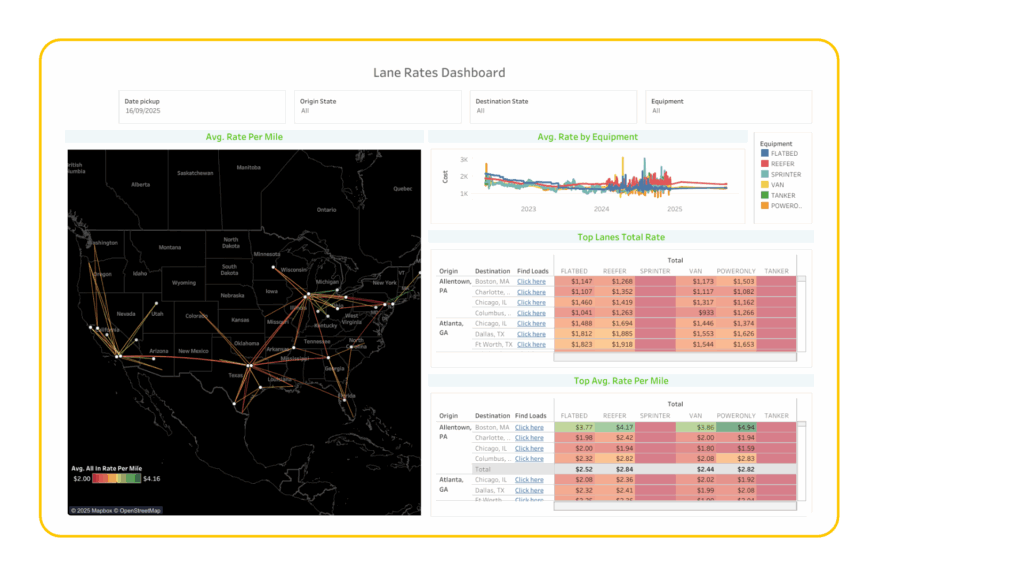
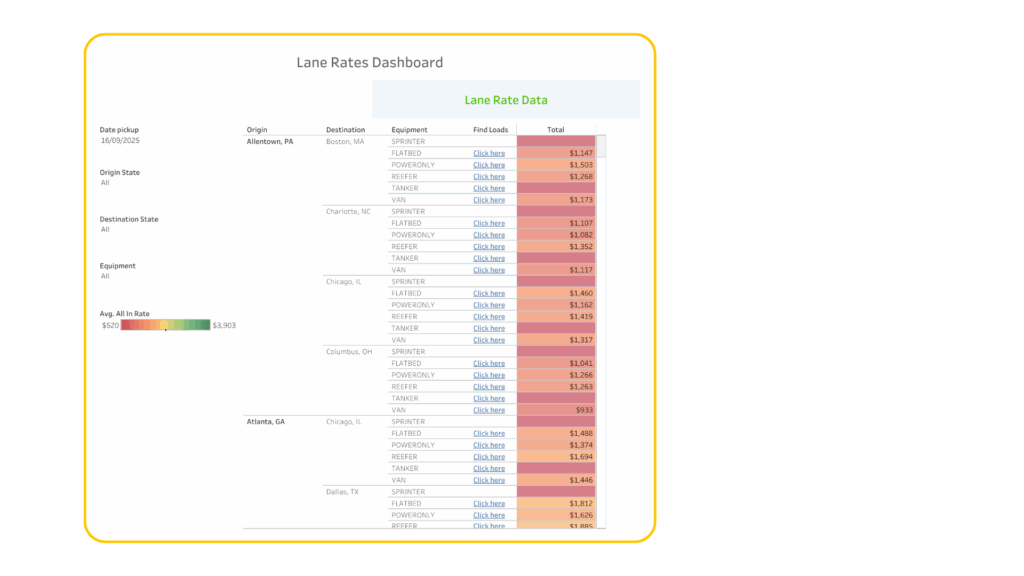
Load Availability & Lane Rates Dashboard
Available to all of our clients is a load board integrated directly into MarketFIT that not only shows you the rates but also helps you find the best available loads quickly.
Below is a highlight of what that data looks like across key markets.
We have data in MarketFIT on 135 critical markets across the entire United States.
You can learn more about MarketFIT and request a demo by visiting MarketFIT.