Each week, MarketFIT™ from Express Freight Finance analyzes real-time freight market data to surface the most favorable and competitive markets across the country.
Rather than reacting to yesterday’s trends or generic load board averages, MarketFIT helps carriers and brokers make smarter decisions in the moment — from where to drive next, to how to price lanes, to when to push for stronger rates.
MarketFIT Platform Overview
With MarketFIT, Express Freight Finance clients gain access to in-depth dashboards covering 125+ U.S. markets and thousands of active freight lanes, all updated continuously to reflect real-world conditions.
If this is your first time here, watch our short overview below featuring Dan Hadley, President & CEO of Express Freight Finance, to see how MarketFIT turns raw data into actionable strategy inside your business.
What This Week’s Data Shows
Below is a snapshot of this week’s live MarketFIT data, highlighting key shifts in demand, capacity, and pricing across top U.S. freight markets.
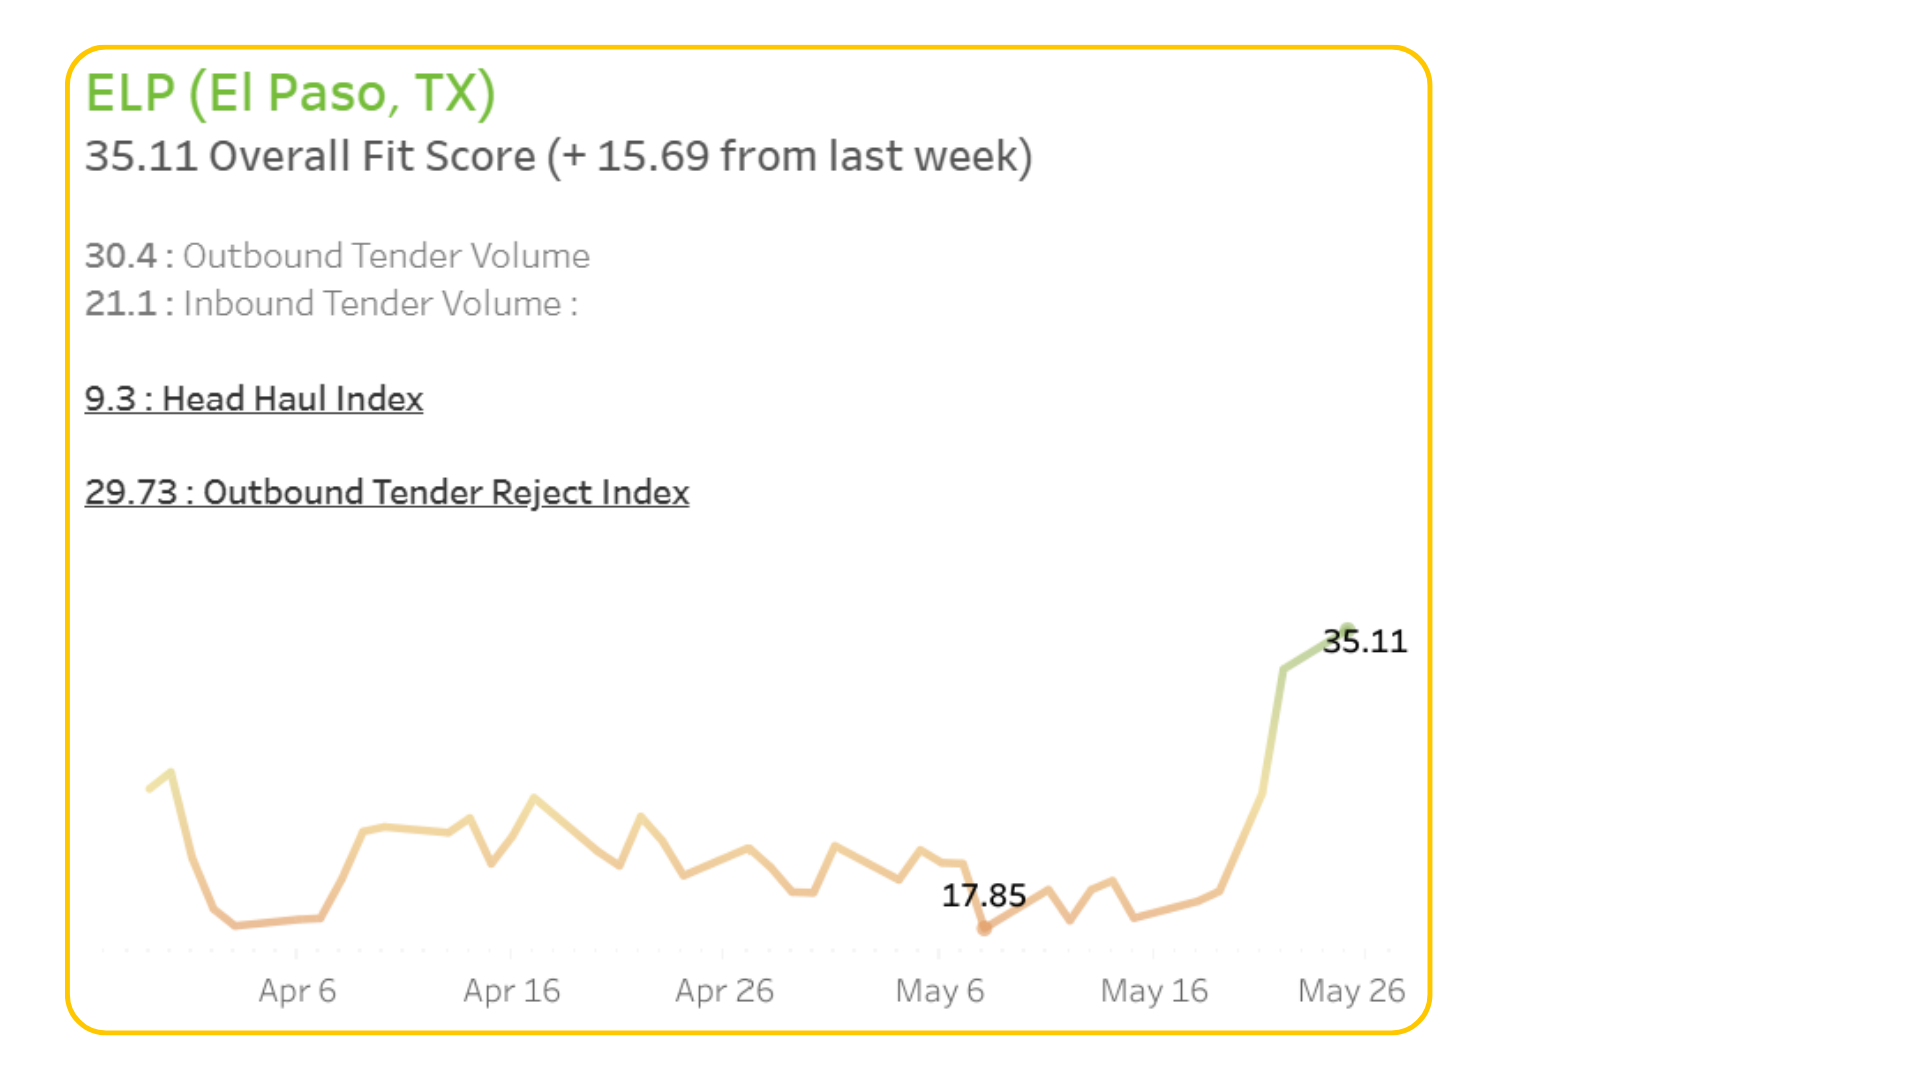
Freight market conditions in El Paso, TX strengthened substantially over the past week, with the Overall Fit Score increasing by 15.69 points to 35.11. The sharp increase reflects improving outbound market dynamics supported by stronger outbound demand and elevated rejection activity. As a key cross-border freight hub connecting U.S. and Mexico supply chains, El Paso is showing signs of tightening capacity conditions that may increasingly favor carriers in the near term.
Outbound Tender Volume is at 30.4, compared to 21.1 for Inbound Tender Volume, resulting in a 9.3 Head Haul Index. This positive differential indicates outbound freight demand is exceeding inbound volumes, creating tighter outbound capacity conditions and improving carrier positioning within the market. While the imbalance is moderate, it suggests that outbound opportunities are beginning to strengthen across regional freight lanes tied to Texas, the Southwest, and cross-border manufacturing activity.
The Outbound Tender Reject Index (OTRI) is currently at 29.73, signaling elevated rejection behavior and continued tightening in the market. Higher rejection levels generally indicate that carriers are becoming more selective with freight, contributing to increased competition for available capacity and potential upward pressure on spot market pricing.
Overall, El Paso is demonstrating meaningful signs of market strengthening, supported by improving outbound demand, favorable headhaul conditions, and elevated carrier rejection activity. The significant increase in the Fit Score suggests momentum is accelerating across this important Southwest freight corridor, with cross-border trade flows, regional distribution activity, and connections into major Texas and western U.S. markets likely to remain important areas to monitor if tightening conditions continue.

Carriers Continue To Ramp Up Profits With These Lanes:
- Joliet, IL → Detroit, MI - Avg. Rate per Mile: $3.63
- Las Vegas, NV → Los Angeles, CA - Avg. Rate per Mile: $3.14
- Las Vegas, NV → Los Angeles, CA - Avg. Rate per Mile: $3.14
These lanes remain well-supported as pricing stays elevated across established Midwest, Northeast, and Southeast freight corridors.

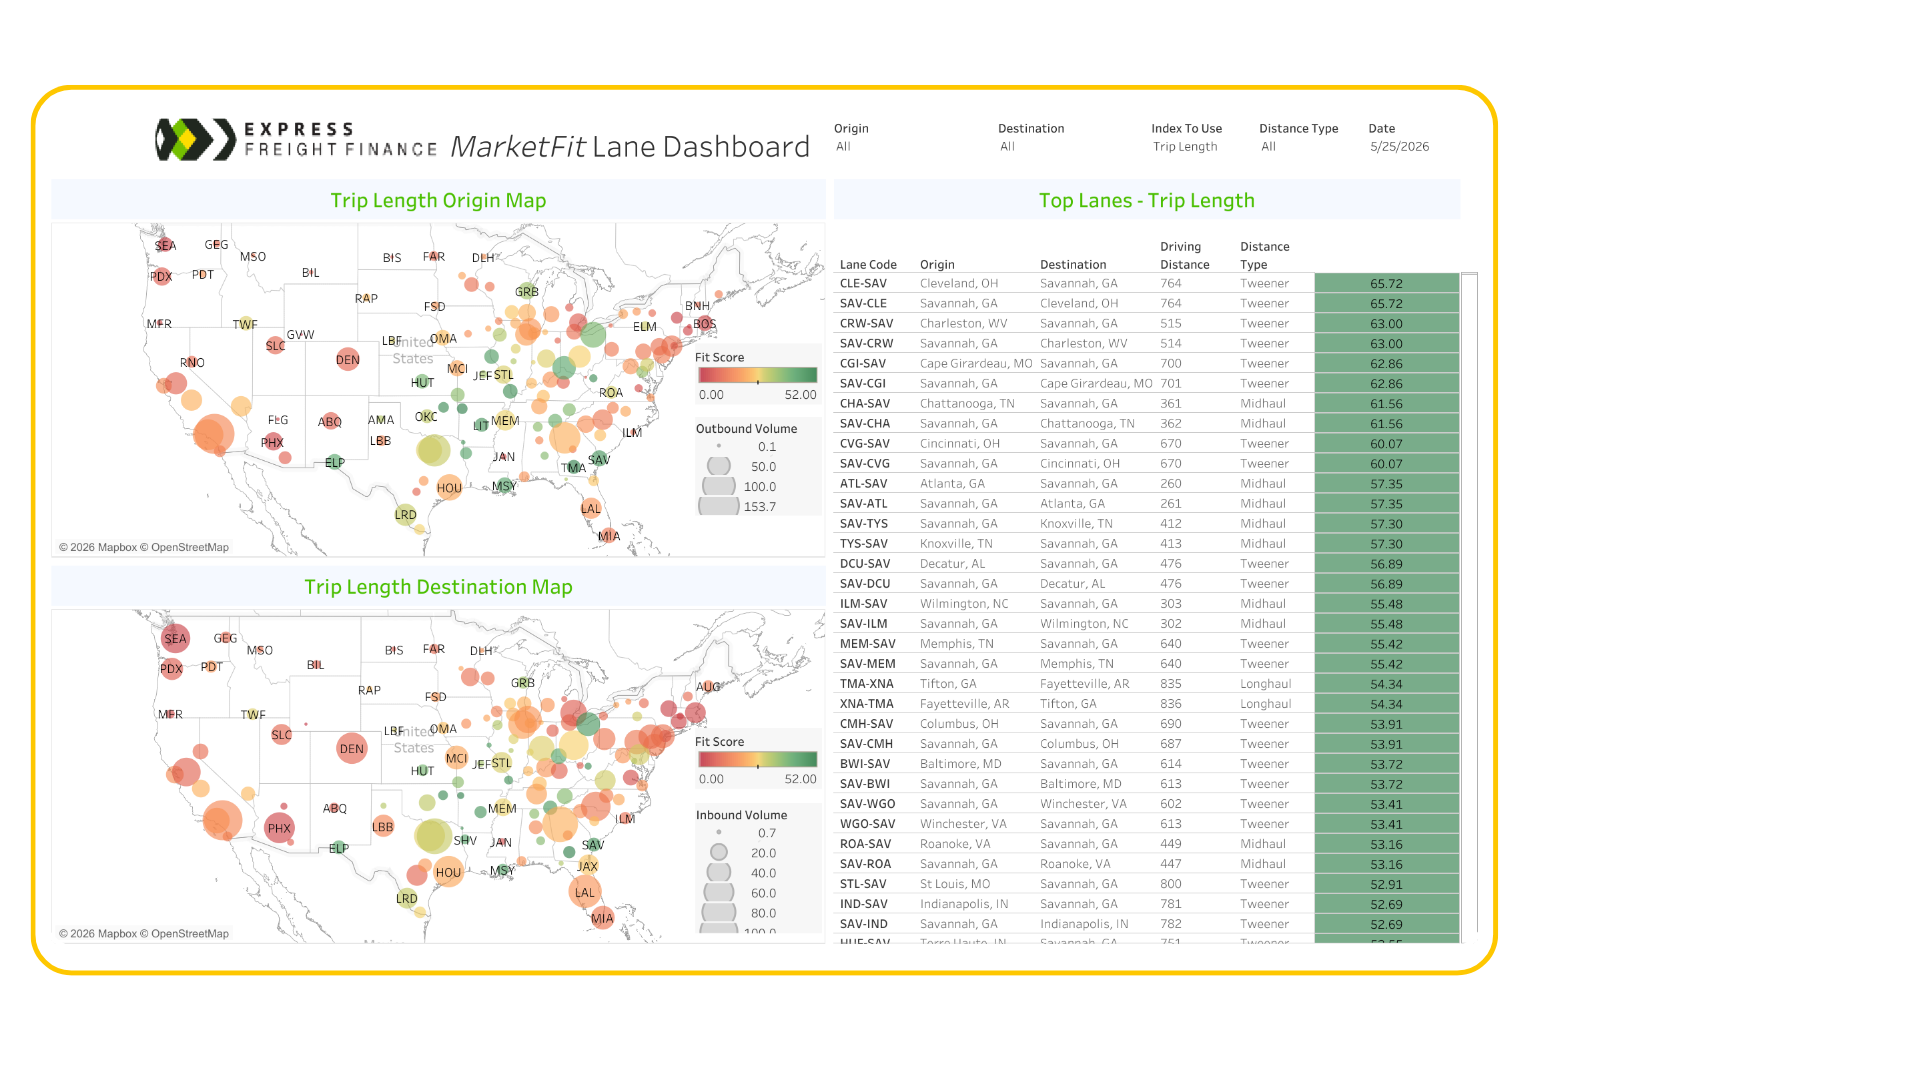
Load Availability & Lane Rates Intelligence
Zero in on where freight is actually moving right now — highlighting lanes with rising demand, tightening capacity, and improving rate potential.
Use this MarketFIT data to spot pockets of opportunity as they emerge, compare lanes side by side, and prioritize routes that offer the best balance of volume and pricing — before conditions shift.
Below is a snapshot of this week’s load availability and lane rate data across key markets.

You can learn more about MarketFIT and request a demo by visiting MarketFIT.