Each week, MarketFIT™ from Express Freight Finance analyzes real-time freight market data to surface the most favorable and competitive markets across the country.
Rather than reacting to yesterday’s trends or generic load board averages, MarketFIT helps carriers and brokers make smarter decisions in the moment — from where to drive next, to how to price lanes, to when to push for stronger rates.
MarketFIT Platform Overview
With MarketFIT, Express Freight Finance clients gain access to in-depth dashboards covering 125+ U.S. markets and thousands of active freight lanes, all updated continuously to reflect real-world conditions.
If this is your first time here, watch our short overview below featuring Dan Hadley, President & CEO of Express Freight Finance, to see how MarketFIT turns raw data into actionable strategy inside your business.
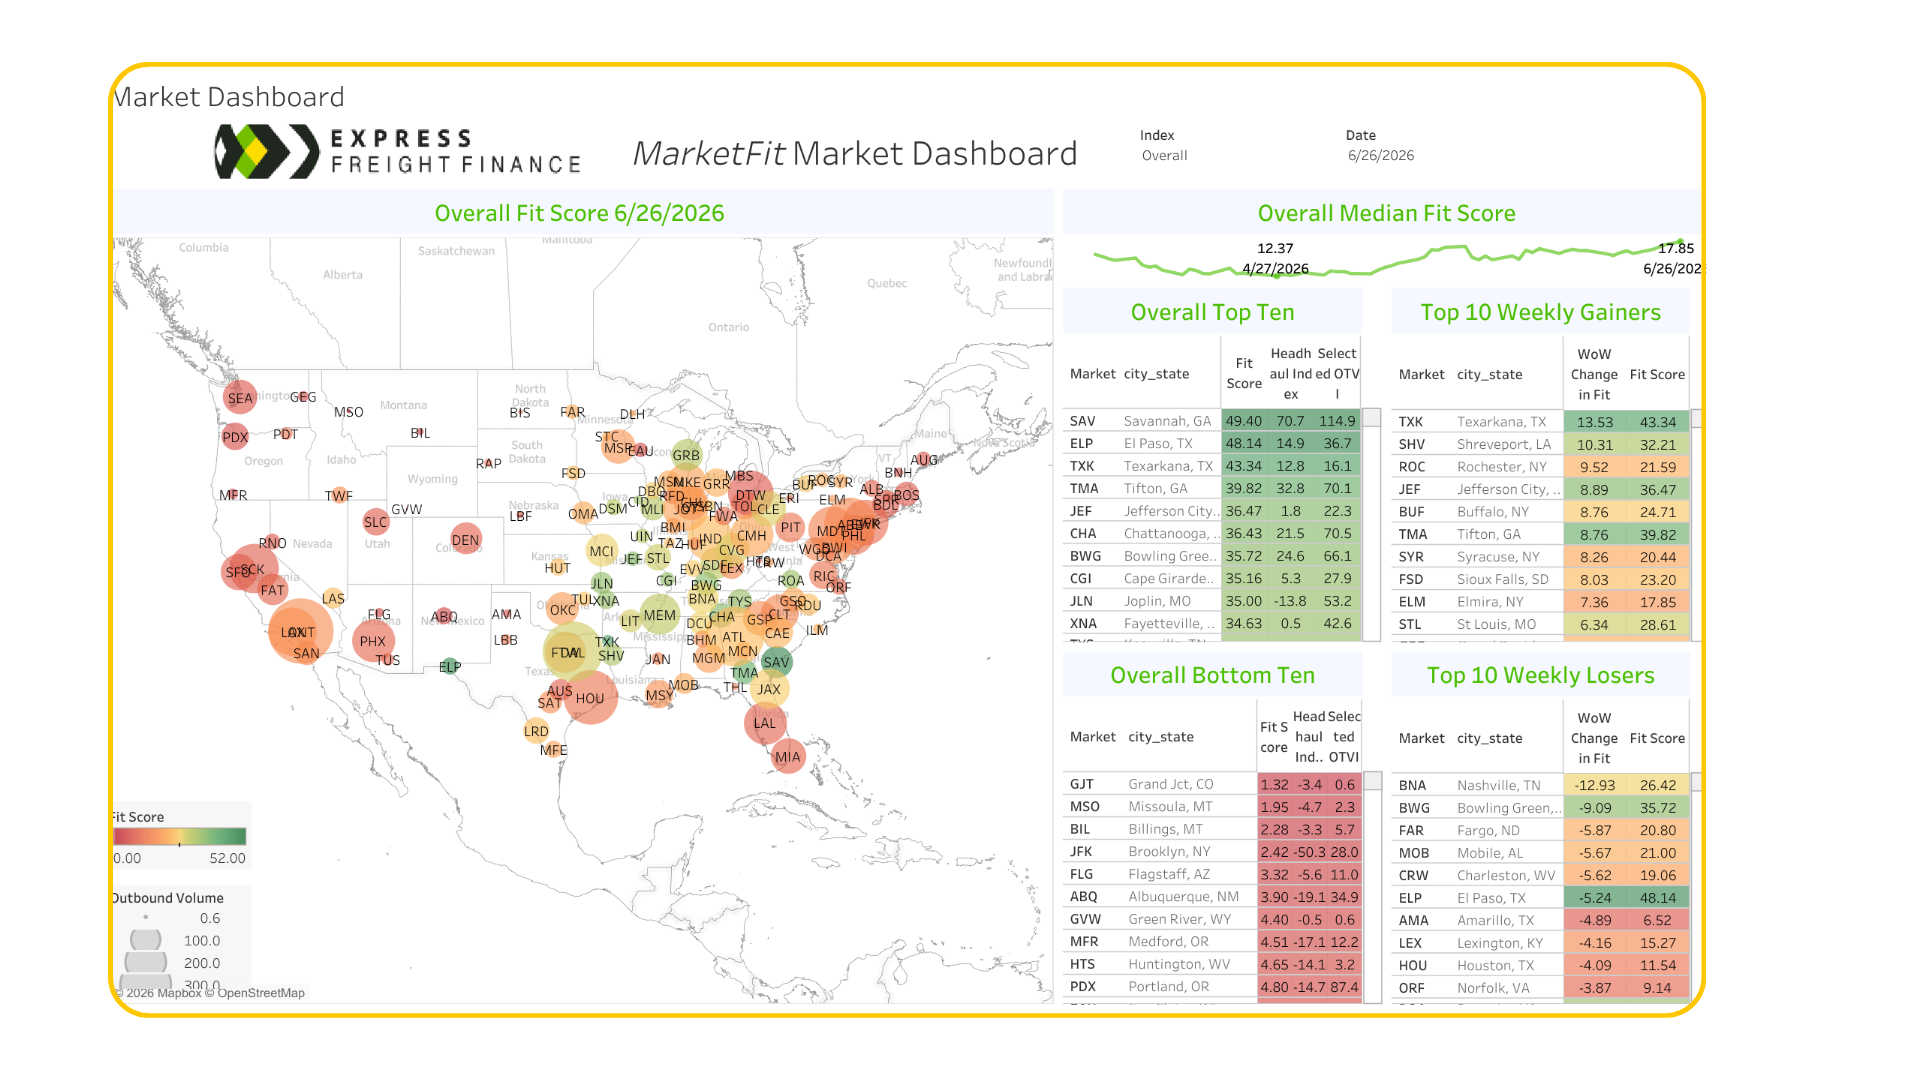
What This Week’s Data Shows
Below is a snapshot of this week’s live MarketFIT data, highlighting key shifts in demand, capacity, and pricing across top U.S. freight markets.
Freight market conditions in Jefferson City, MO strengthened notably over the past week, with the Overall Fit Score increasing by 8.89 points to 36.47. This meaningful improvement reflects strengthening freight fundamentals supported by balanced freight flows, elevated carrier rejection rates, and improving market dynamics. Located in central Missouri with access to key regional transportation corridors, Jefferson City continues to benefit from stable outbound shipping activity and tightening capacity conditions that are becoming increasingly favorable for carriers
Outbound Tender Volume is at 22.3, compared to 20.5 for Inbound Tender Volume, resulting in a 1.8 Head Haul Index. This modest positive differential indicates that outbound freight demand is slightly exceeding inbound volumes, creating a balanced but favorable headhaul environment for carriers operating in the market. While the freight imbalance remains relatively limited compared to larger distribution markets, the positive Head Haul Index suggests that outbound demand is sufficient to support healthy equipment utilization and maintain stable capacity conditions. Markets with modest headhaul advantages often experience more consistent freight flows while avoiding the extreme imbalances that can create excessive volatility.
The Outbound Tender Reject Index (OTRI) is currently at 34.99, signaling elevated rejection activity and continued capacity tightness. Rejection levels above 30 generally indicate a highly competitive freight environment where carriers have greater flexibility to be selective about the freight they accept. This elevated rejection rate suggests that contract capacity remains constrained, encouraging additional participation in the spot market and placing upward pressure on transportation rates as shippers compete to secure available truckload capacity.
Overall, Jefferson City is demonstrating improving market momentum, supported by balanced outbound demand, a modestly favorable headhaul balance, and elevated carrier rejection behavior. The significant increase in the Fit Score highlights strengthening freight market conditions and suggests that capacity is tightening relative to freight demand. Regional manufacturing activity, agricultural freight movements, consumer goods distribution, and Jefferson City’s strategic location within Missouri’s transportation network will remain important factors to monitor as market conditions continue to evolve.

Carriers Continue To Ramp Up Profits With These Lanes:
- Allentown, PA → Boston, MA - Avg. Rate per Mile: $4.19
- Chicago, IL → Detroit, MI - Avg. Rate per Mile: $3.73
- Ontario, CA → Stockton, CA - Avg. Rate per Mile: $3.24
These lanes remain well-supported as pricing stays elevated across established Midwest, Northeast, and Southeast freight corridors.
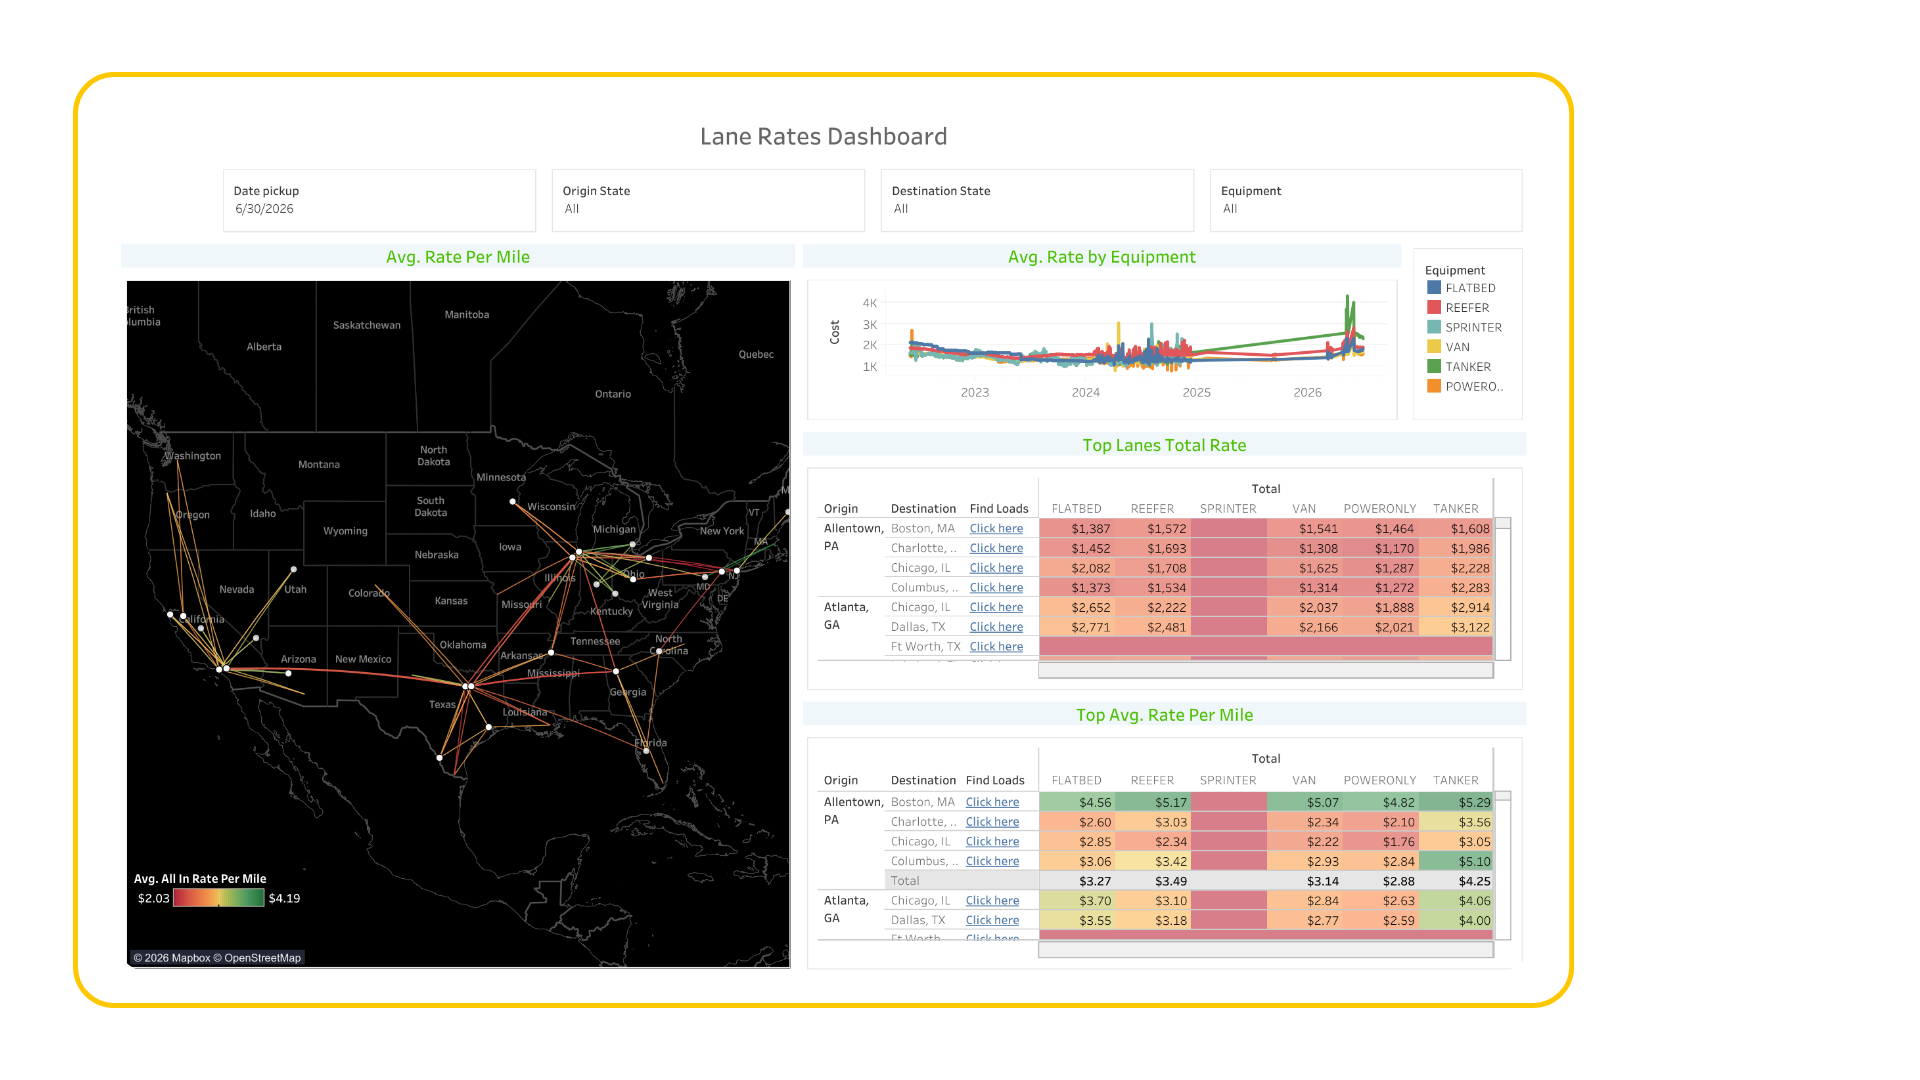
Load Availability & Lane Rates Intelligence
Zero in on where freight is actually moving right now — highlighting lanes with rising demand, tightening capacity, and improving rate potential.
Use this MarketFIT data to spot pockets of opportunity as they emerge, compare lanes side by side, and prioritize routes that offer the best balance of volume and pricing — before conditions shift.
Below is a snapshot of this week’s load availability and lane rate data across key markets.
You can learn more about MarketFIT and request a demo by visiting MarketFIT.