Each week, MarketFIT™ from Express Freight Finance analyzes real-time freight market data to surface the most favorable and competitive markets across the country.
Rather than reacting to yesterday’s trends or generic load board averages, MarketFIT helps carriers and brokers make smarter decisions in the moment — from where to drive next, to how to price lanes, to when to push for stronger rates.
MarketFIT Platform Overview
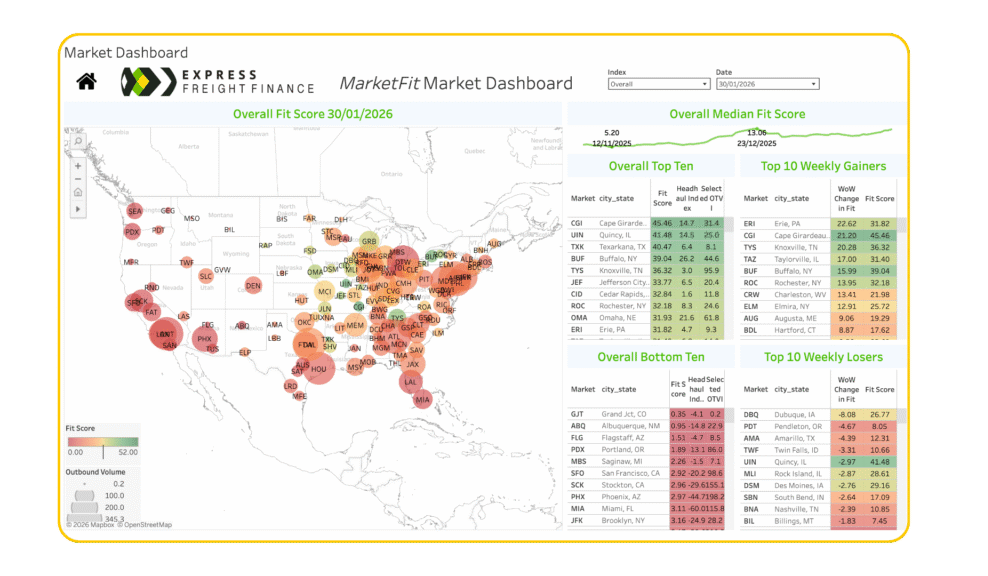
With MarketFIT, Express Freight Finance clients gain access to in-depth dashboards covering 125+ U.S. markets and thousands of active freight lanes, all updated continuously to reflect real-world conditions.
If this is your first time here, watch our short overview below featuring Dan Hadley, President & CEO of Express Freight Finance, to see how MarketFIT turns raw data into actionable strategy inside your business.
What This Week’s Data Shows
Below is a snapshot of this week’s live MarketFIT data, highlighting key shifts in demand, capacity, and pricing across top U.S. freight markets.
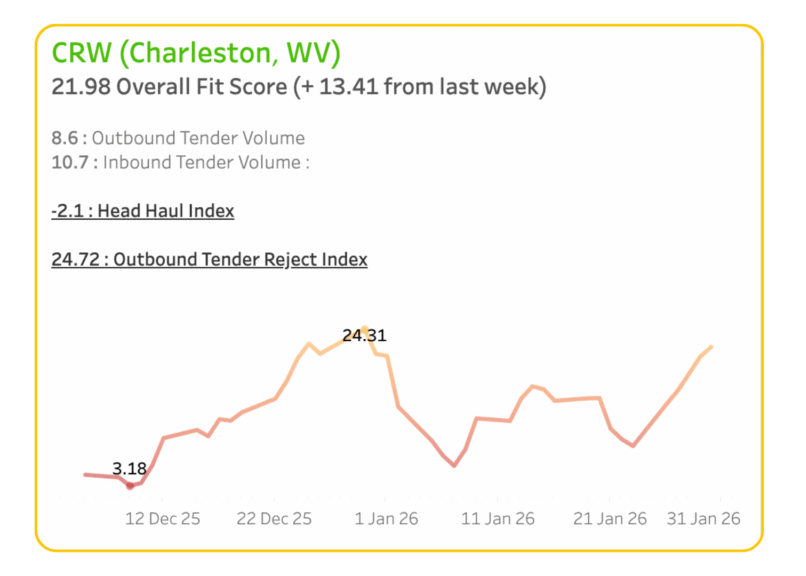
Charleston, WV posts a notable week-over-week improvement, with the Overall Fit Score rising by 13.41 points to 21.98, signaling accelerating momentum across local freight conditions. While Charleston is not traditionally viewed as a core headhaul market, this sharp WoW increase points to a meaningful shift in supply-demand dynamics, driven by rising carrier selectivity and tightening effective capacity.
Outbound Tender Volume stands at 8.6, while Inbound Tender Volume comes in slightly higher at 10.7, resulting in a -2.1 Head Haul Index. Despite this mild backhaul profile, the Outbound Tender Reject Index (OTRI) at 24.72 highlights elevated carrier leverage, indicating that capacity is tightening even in markets without a classic headhaul imbalance, a pattern also emerging across nearby Northeast secondary markets such as Erie, PA and Rochester, NY.
Overall, Charleston is emerging as a market to watch not because of extreme volume, but due to rapid momentum and rising rejection behavior. This pattern underscores a broader MarketFit signal: leverage can develop quickly in secondary markets when carrier selectivity increases, even before volumes fully rebalance. Similar momentum is visible across markets like Erie, PA and Rochester, NY, suggesting tightening conditions across connected regional corridors. If this trend continues, shippers should expect increasing rate pressure and reduced truck availability in the near term.
Carriers Continue To Ramp Up Profits With These Lanes:
- Allentown, PA → Boston, MA – Avg. Rate per Mile: $3.77
- Cincinnati, OH → Chicago, IL – Avg. Rate per Mile: $3.60
- Atlanta, GA → Chicago, IL – Avg. Rate per Mile: $2.08
These lanes remain well-supported as Midwest freight demand stays resilient and capacity continues to tighten across key regional corridors.

Load Availability & Lane Rates Intelligence
Zero in on where freight is actually moving right now — highlighting lanes with rising demand, tightening capacity, and improving rate potential.
Use this MarketFIT data to spot pockets of opportunity as they emerge, compare lanes side by side, and prioritize routes that offer the best balance of volume and pricing — before conditions shift.
Below is a snapshot of this week’s load availability and lane rate data across key markets.


You can learn more about MarketFIT and request a demo by visiting MarketFIT.

