
Each week, MarketFIT™ from Express Freight Finance analyzes real-time freight market data to surface the most favorable and competitive markets across the country.
Rather than reacting to yesterday’s trends or generic load board averages, MarketFIT helps carriers and brokers make smarter decisions in the moment — from where to drive next, to how to price lanes, to when to push for stronger rates.
MarketFIT Platform Overview
With MarketFIT, Express Freight Finance clients gain access to in-depth dashboards covering 125+ U.S. markets and thousands of active freight lanes, all updated continuously to reflect real-world conditions.
If this is your first time here, watch our short overview below featuring Dan Hadley, President & CEO of Express Freight Finance, to see how MarketFIT turns raw data into actionable strategy inside your business.
What This Week’s Data Shows
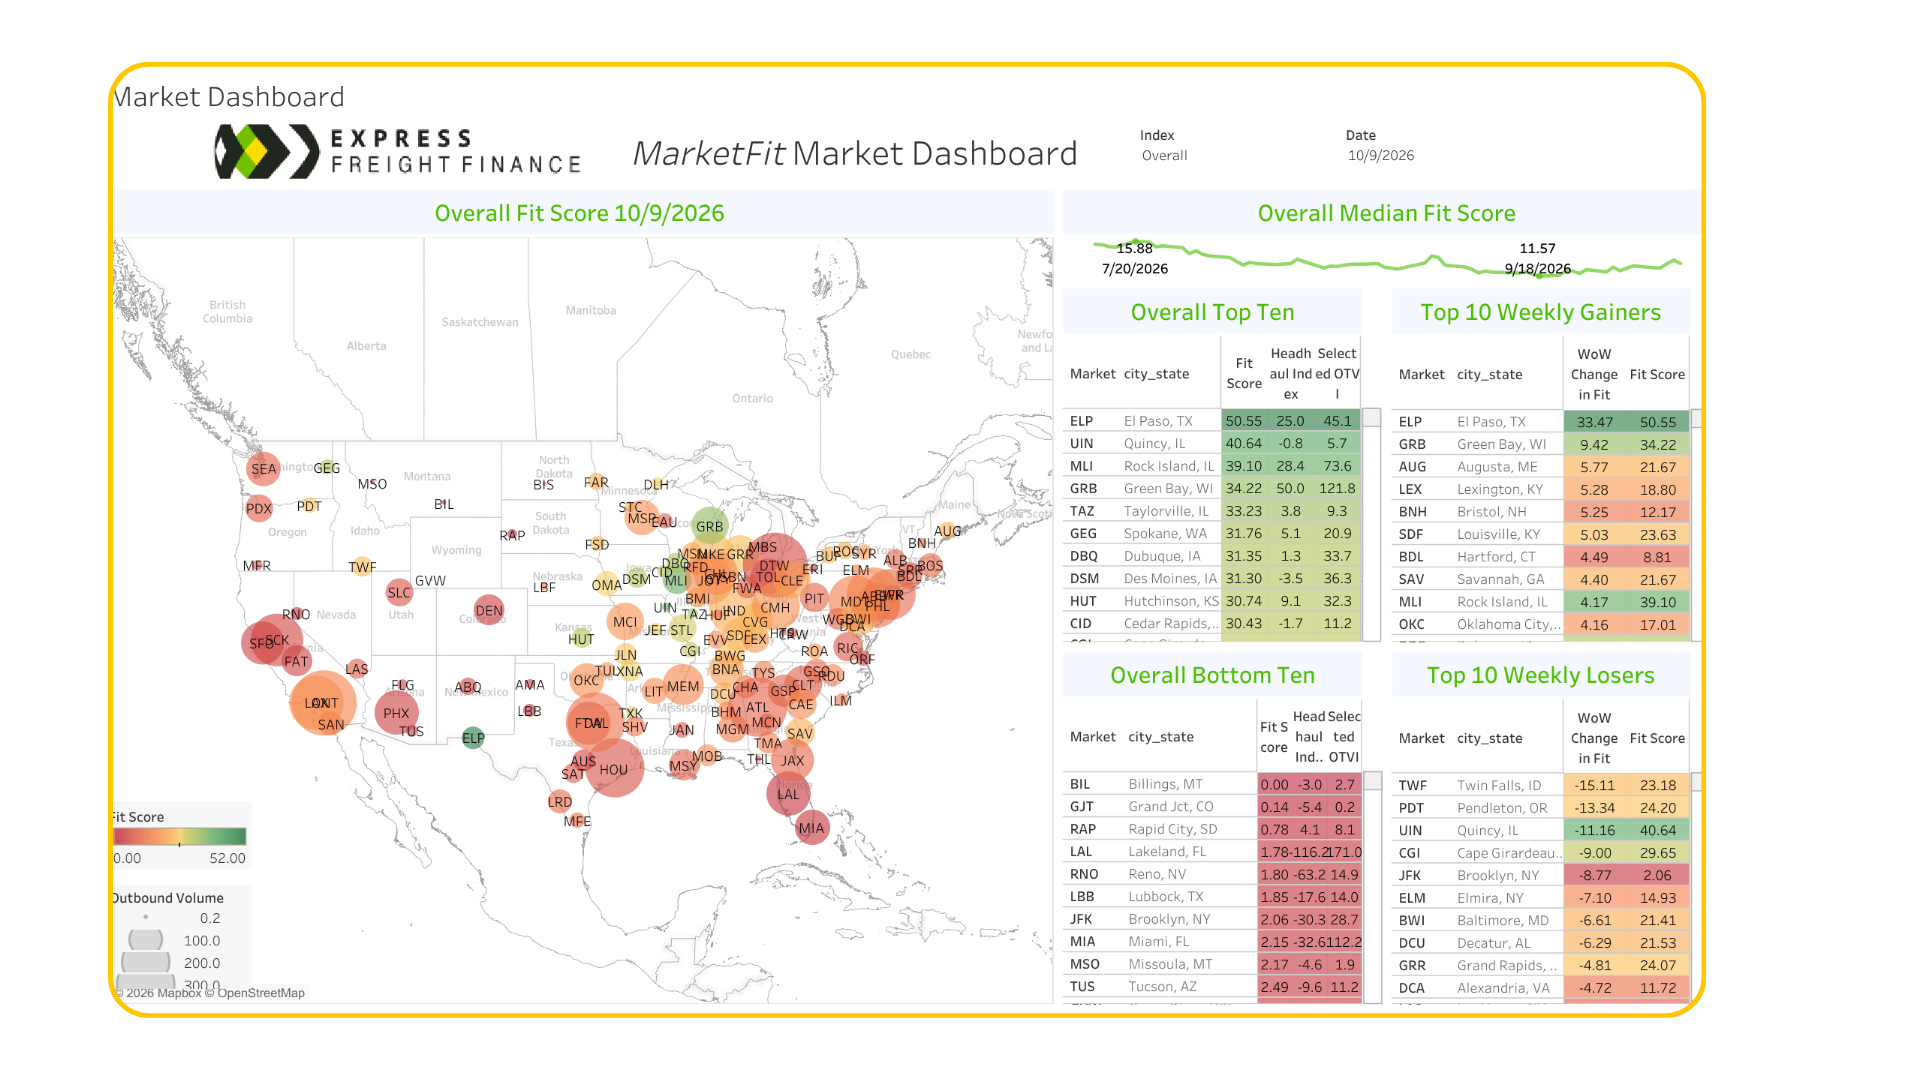
Below is a snapshot of this week’s live MarketFIT data, highlighting key shifts in demand, capacity, and pricing across top U.S. freight markets.
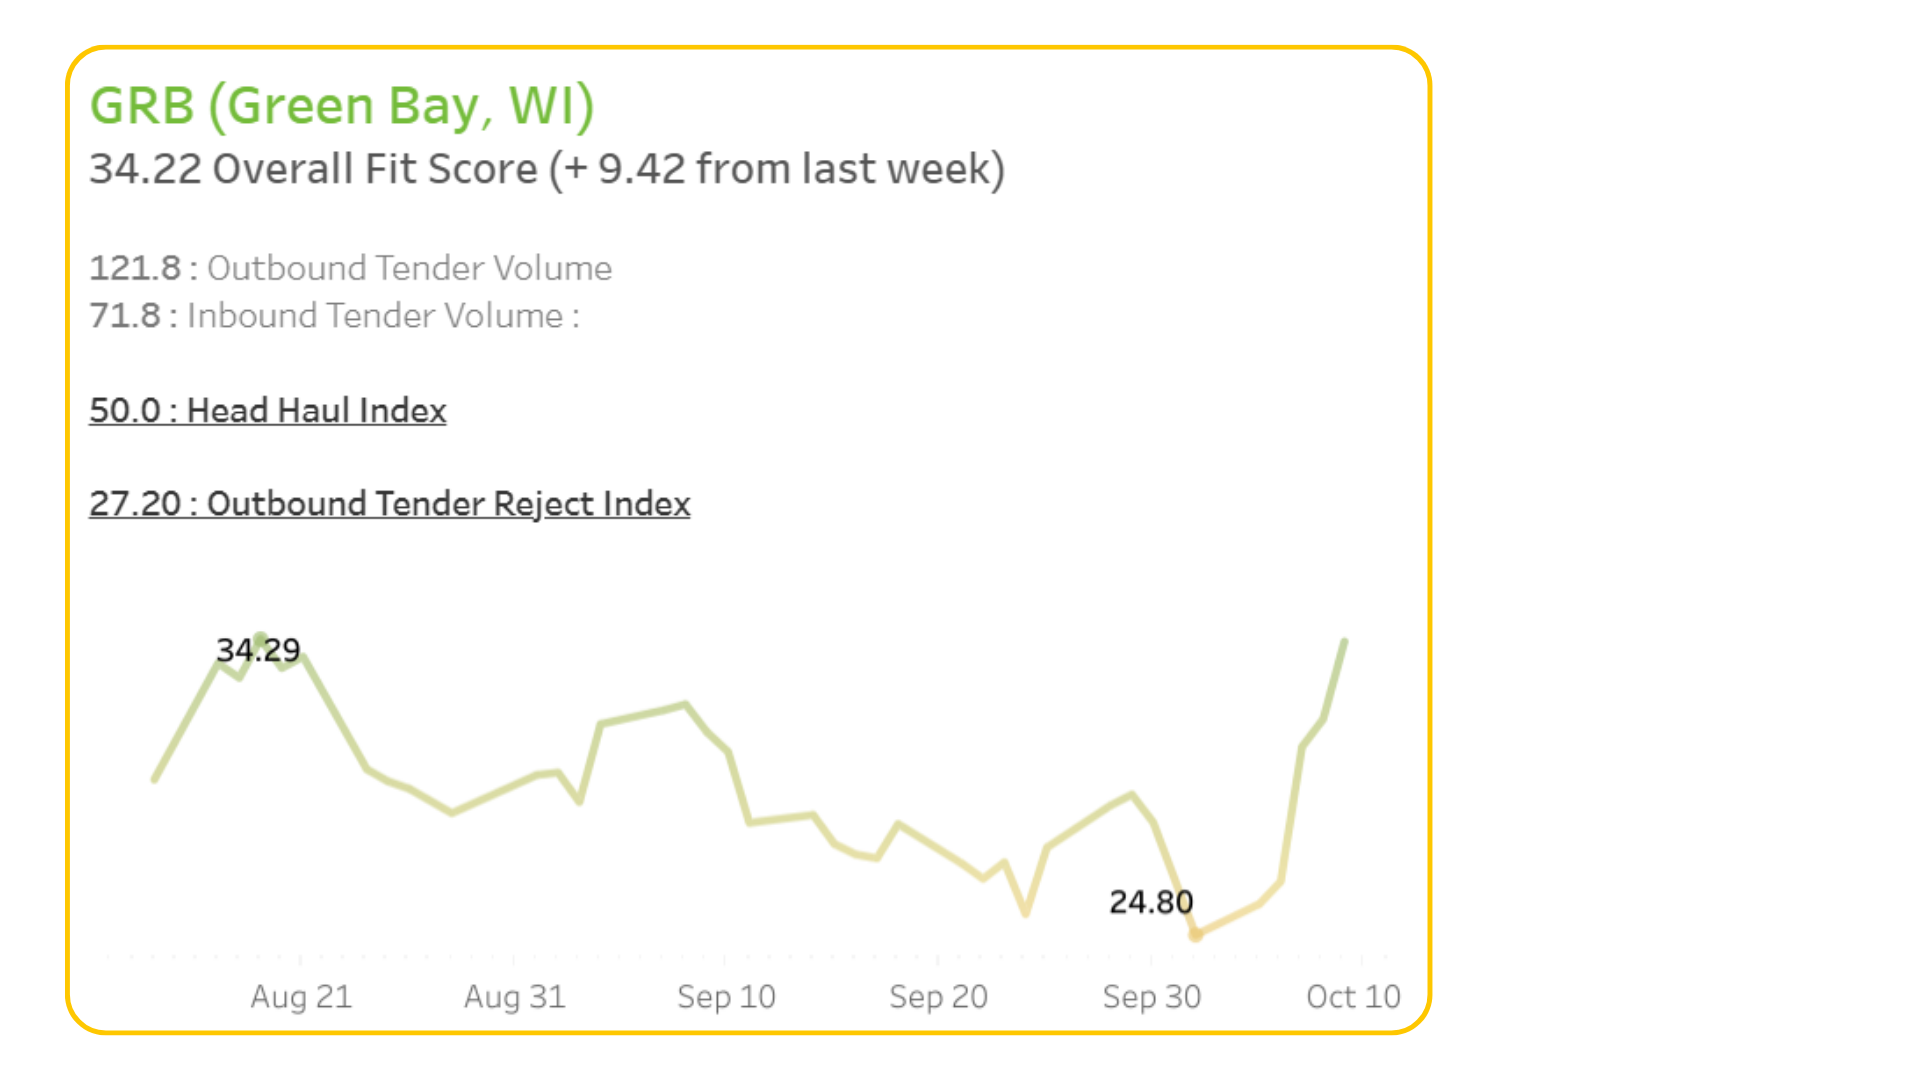
Freight market conditions in Green Bay, WI improved sharply over the past week, with the Overall Fit Score increasing by 9.42 points to 34.22. The increase marks a strong recovery from the early-October low of 24.80 and brings the score close to the August peak shown in the chart. The rebound points to improving market momentum, while outbound freight demand and elevated carrier rejection activity suggest continued pressure on available capacity.
Outbound Tender Volume is at 121.8, compared to 71.8 for Inbound Tender Volume, resulting in a +50.0 Head Haul Index. This positive differential indicates that outbound freight volume exceeds inbound volume, potentially creating greater competition for equipment departing Green Bay. That imbalance may support upward pressure on spot rates and reduce capacity options for shippers. However, actual equipment availability will depend on carrier positioning, shipment schedules, and lane-specific requirements.
The Outbound Tender Reject Index (OTRI) is currently at 27.20, indicating elevated carrier rejection activity. An OTRI near 27 suggests that carriers are rejecting roughly one out of every four contracted outbound tenders, potentially pushing some freight into the spot market. This level of rejection is particularly notable alongside the positive Head Haul Index. Together, these indicators suggest that securing contracted capacity may be challenging for some outbound shipments.
Overall, Green Bay is showing a substantial week-over-week improvement in its Fit Score, while the underlying indicators point to outbound capacity pressure. Outbound volume exceeds inbound volume, and carrier rejections remain elevated. Shippers may face higher costs or service challenges on specific lanes, particularly for shipments with limited scheduling flexibility. The next signal to watch is whether rejection activity eases as additional equipment enters the market, or whether the outbound imbalance continues to sustain capacity constraints alongside the stronger Fit Score.
Carriers Continue To Find Strong Opportunities With These Lanes:
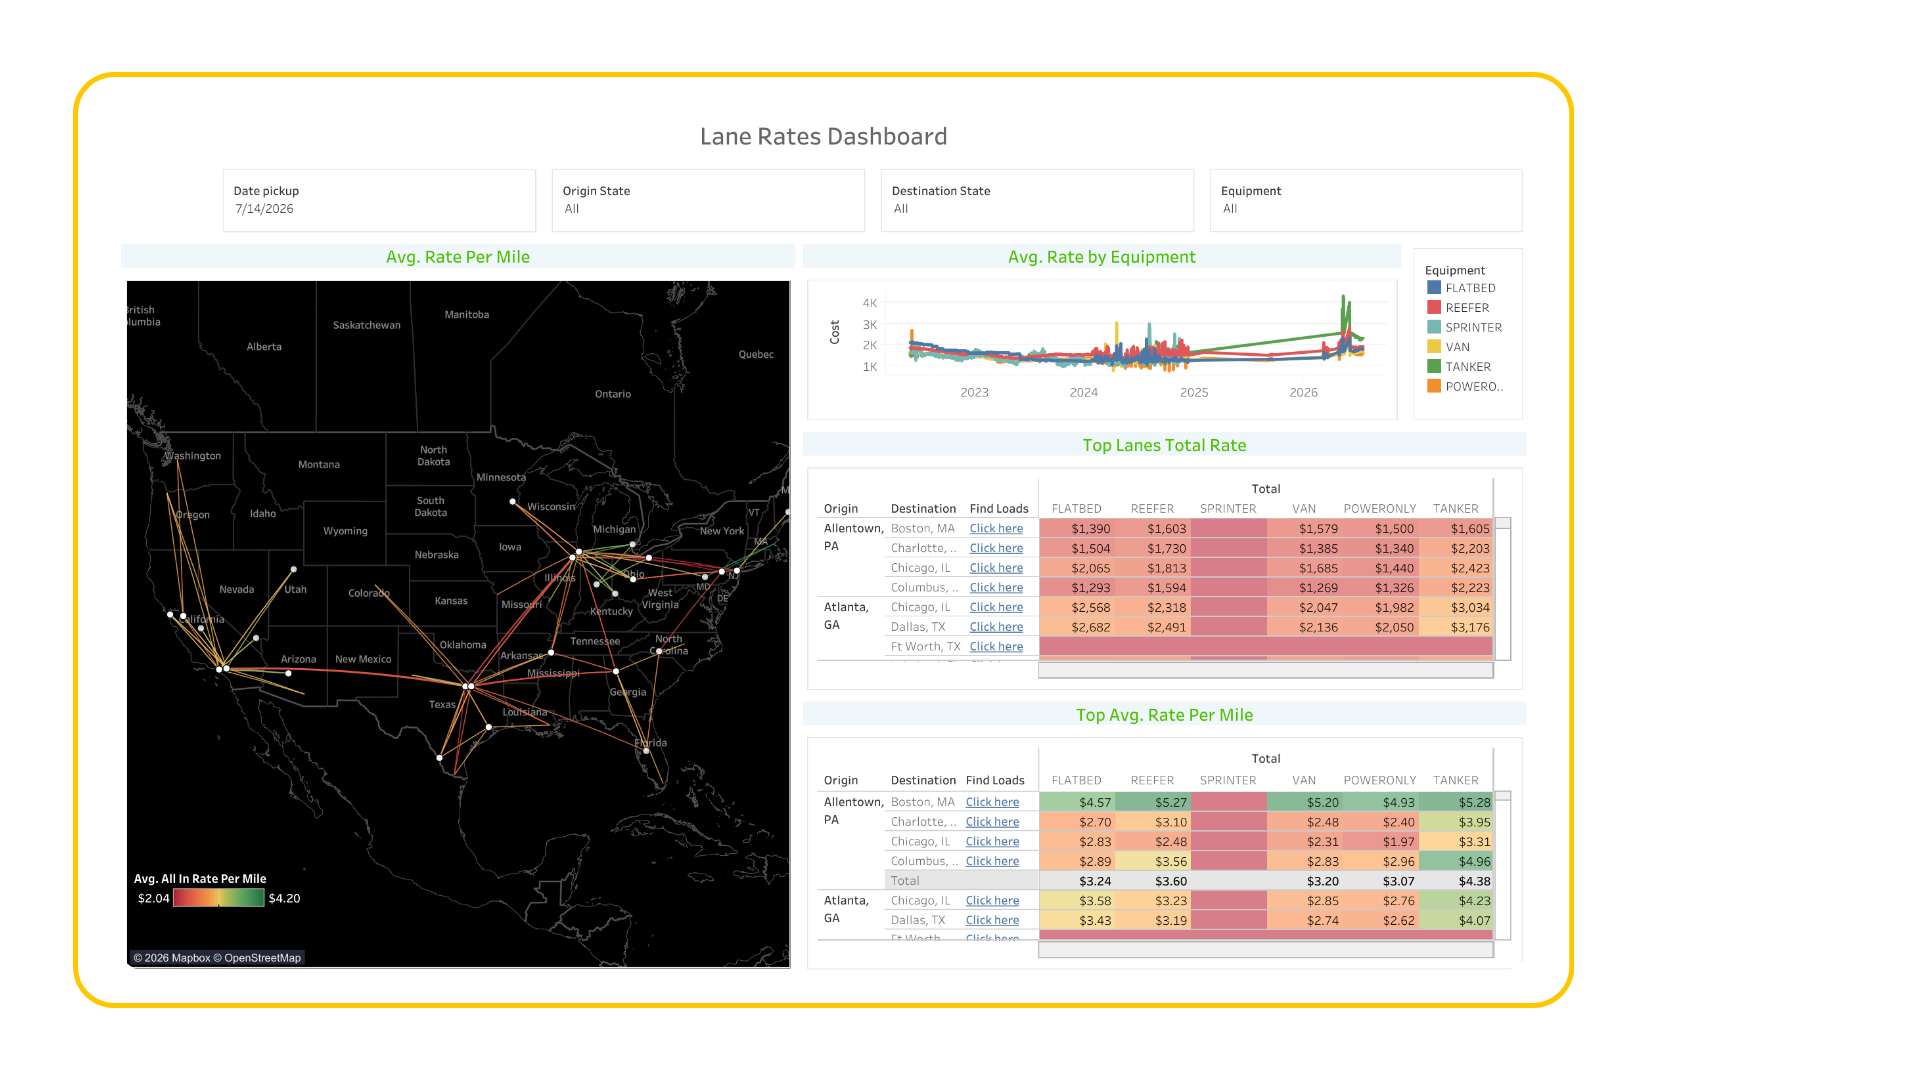
- Allentown, PA → Boston, MA — Avg. Rate per Mile: $4.20
- Joliet, IL →, Detroit, MI — Avg. Rate per Mile: $3.67
- Las Vegas, NV → Los Angeles, CA — Avg. Rate per Mile: $3.14
These lanes continue to offer attractive earning potential as pricing remains elevated across major Northeast, Midwest, and Southeast freight corridors, providing carriers with consistent opportunities in high-demand regional markets.
Load Availability & Lane Rates Intelligence
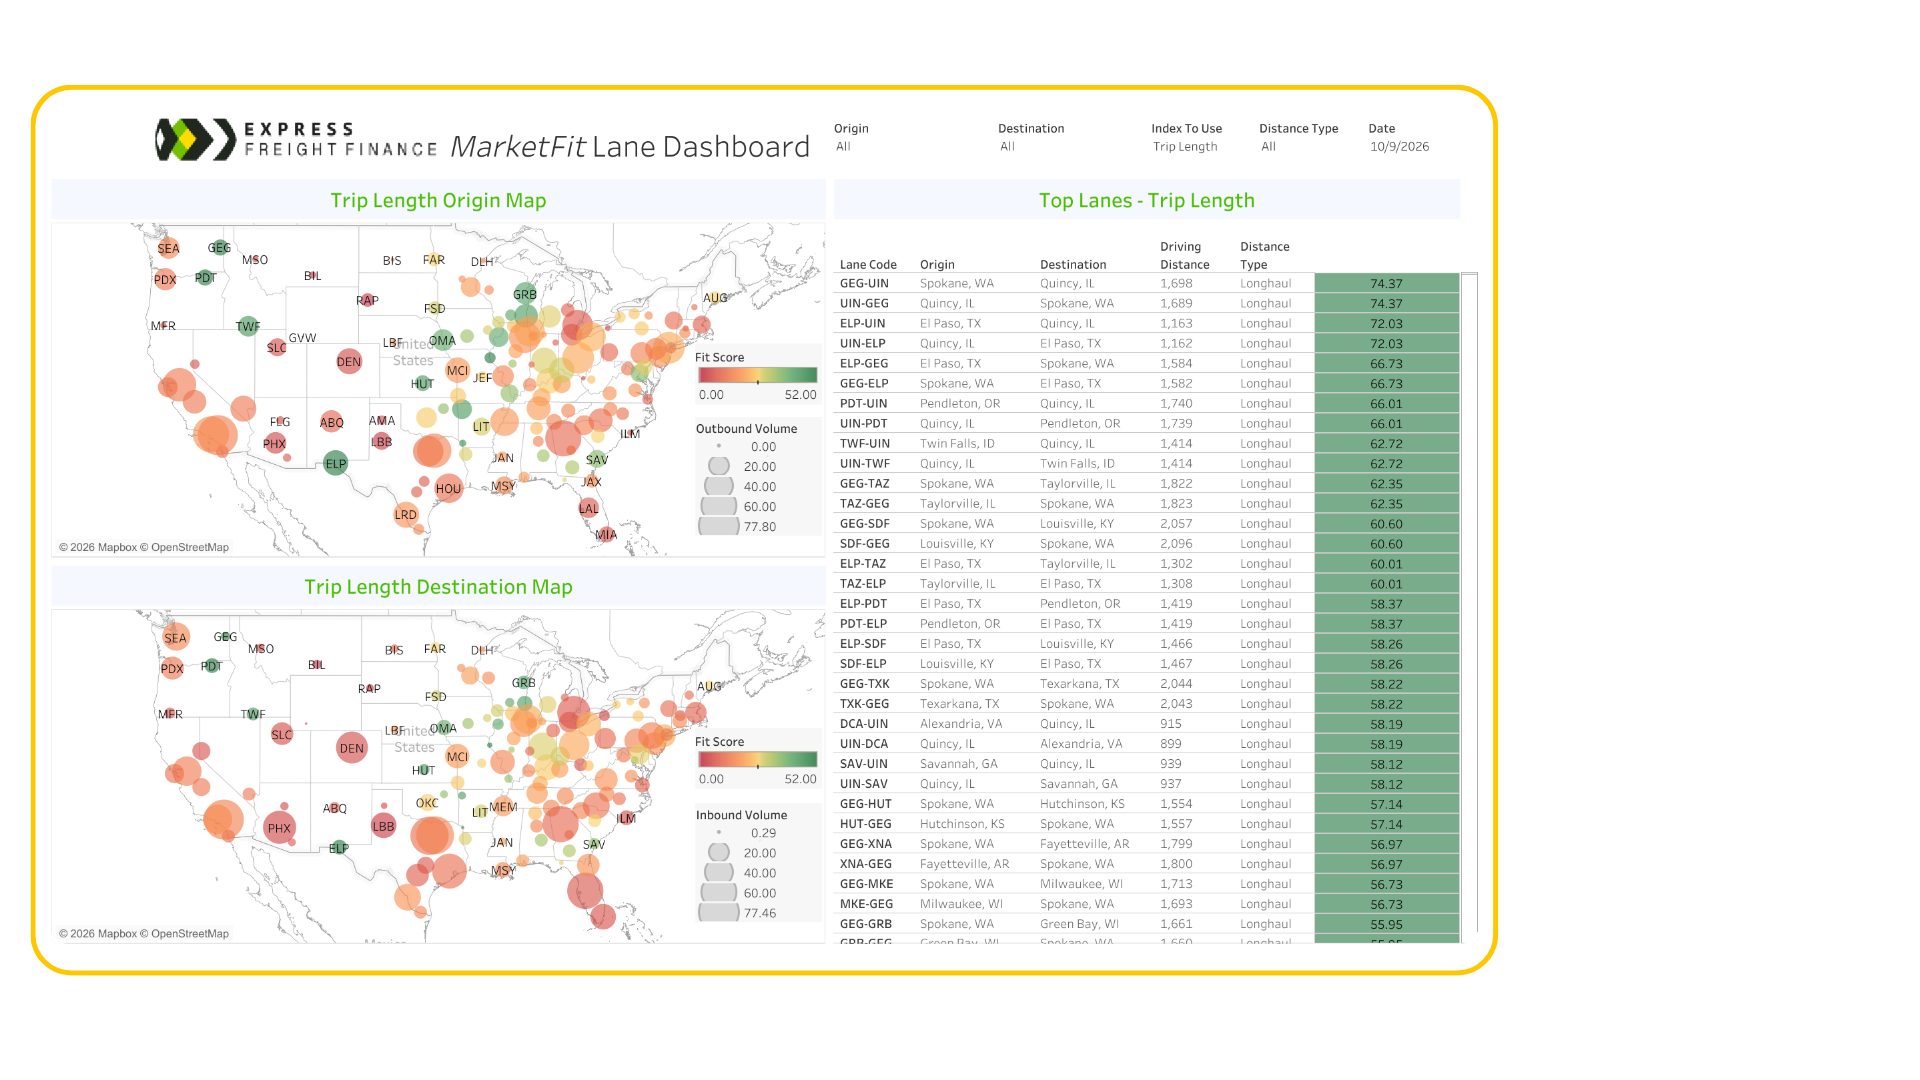
Zero in on where freight is actually moving right now — highlighting lanes with rising demand, tightening capacity, and improving rate potential.
Use this MarketFIT data to spot pockets of opportunity as they emerge, compare lanes side by side, and prioritize routes that offer the best balance of volume and pricing — before conditions shift.
Below is a snapshot of this week’s load availability and lane rate data across key markets.

You can learn more about MarketFIT and request a demo by visiting MarketFIT.