
MarketFIT, from Express Freight, is the first tool of its kind that allows carriers to use data to quickly identify the most favorable and competitive freight markets in the US.
All of our clients have access to in-depth dashboards on over 125 markets across the US and countless lanes between these markets.
This is a snapshot of live data from this week to give you an upper hand as you plan your routes and negotiate rates. Reach out to us if you’re interested in getting access to the full platform.
Now, let’s see a snapshot of live data from this week to give you an upper hand as you plan your routes and negotiate rates. Reach out to us at 877.807.3006, if you’re interested in getting access to the full platform.
Market Highlight: Rapid City, SD
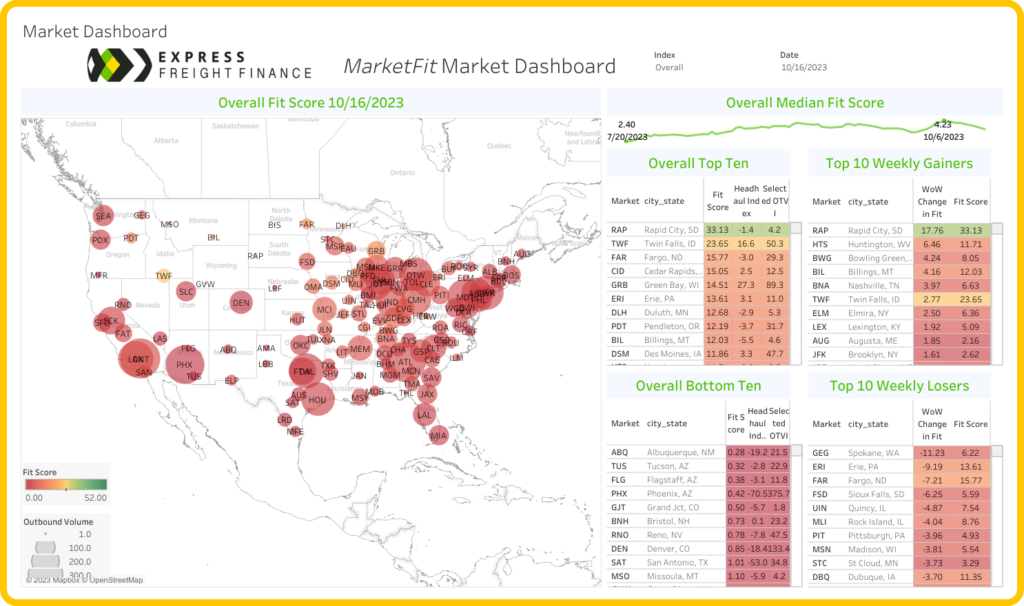
Rapid City has experienced some of this week’s largest market improvement, with the FIT Score increasing 16.67 points from the previous week. It’s significantly higher than it was even a few weeks ago. This market is the strongest in the Western parts of the US, but here are other bright spots throughout the map this week.
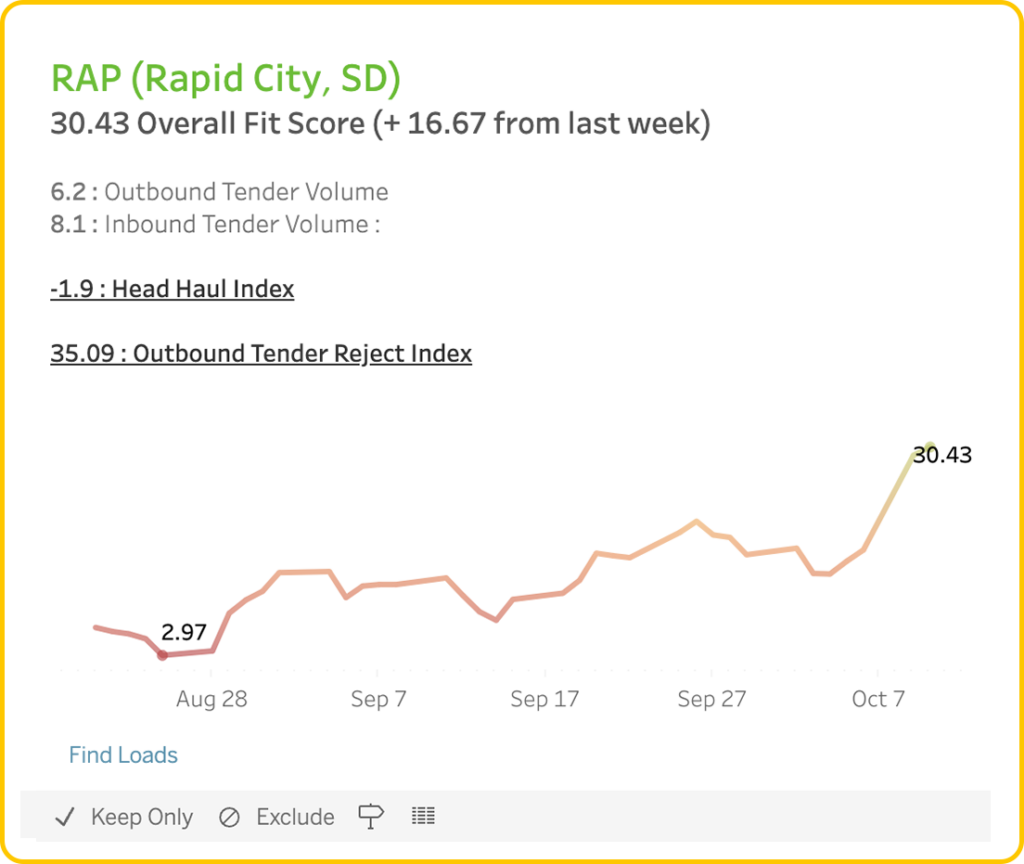
What this means for carriers
- Carriers inbound to Rapid City may find an easier time finding outbound freight relative to other markets as outbound tenders currently exceed inbound freight volume.
- Tender rejection of contracted freight are above national averages, indicating more freight may be available on the sport market in the short term.
Market Snapshot: Giving Up Some of the Recent Gains
This week, we’re seeing the overall market soften from recent highs a few weeks ago.
The US MarketFIT score is up 3.46, down from its recent high of 4.23.
We will be watching this number closely as we head into peak season to see how it moves over the next few weeks.
Lane Rates: Positive Movement in the Midwest
This week, we’re seeing some positive scores in the Midwest, and in particular, in Michigan, Ohio, and Pennsylvania.
Carriers running lanes in the midwest this week should be able to find slightly more favorable rates in key lanes.
We’ll keep an eye out to determine if these key markets continue to move in the right direction.
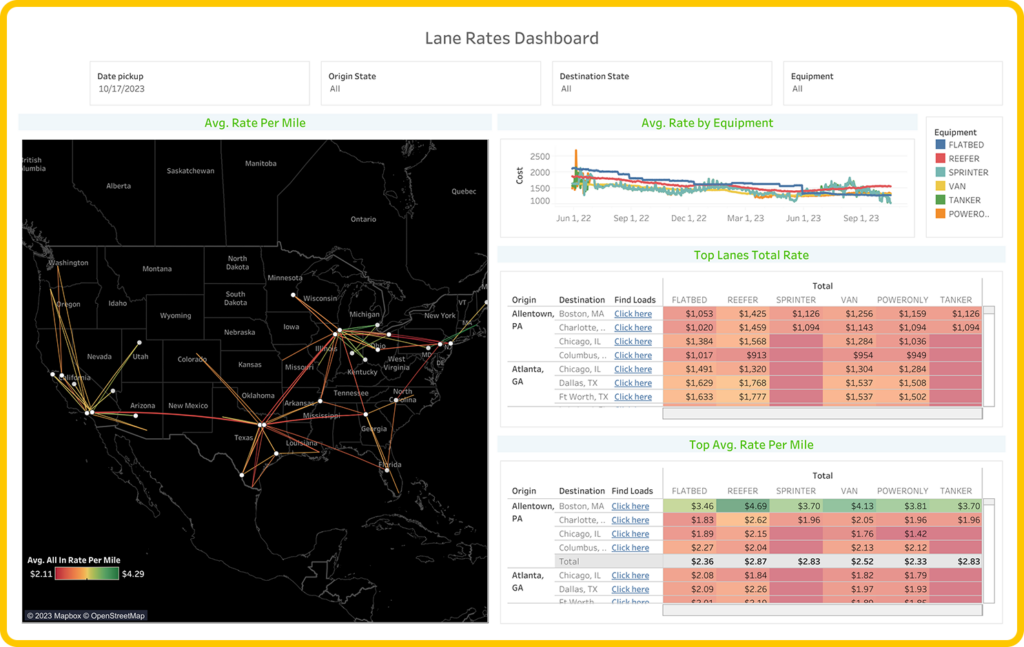
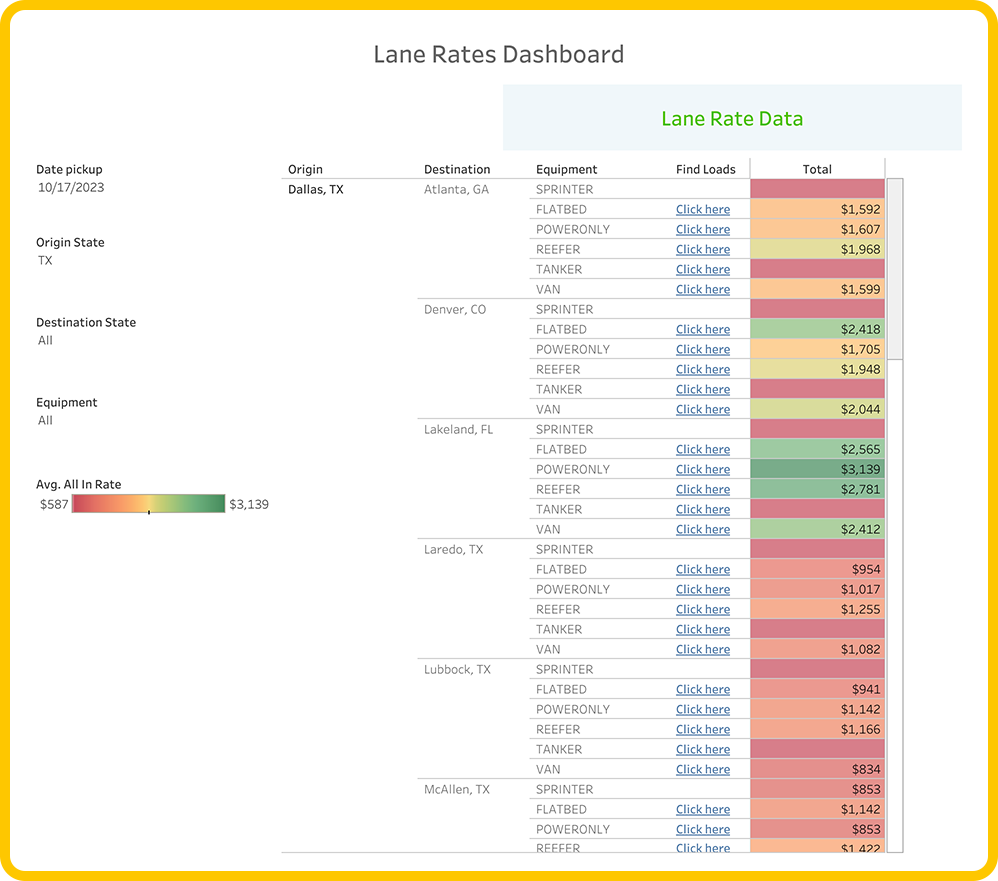
Load Availability & Lane Rates Dashboard
Available to all of our clients is a load board integrated directly into MarketFIT that not only shows you the rates but also helps you find the best available loads quickly.
Below is a highlight of what that data looks like across key markets in Texas and California.
We have data in MarketFIT on 135 critical markets across the entire United States.
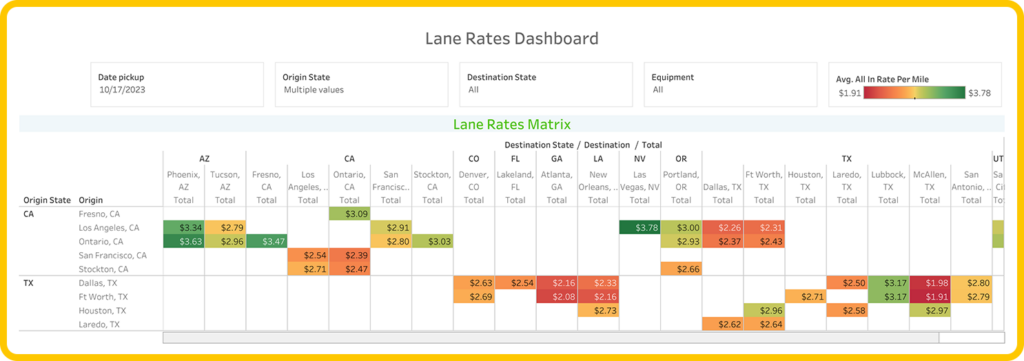
You can learn more about MarketFIT and request a demo by visiting our site.