
MarketFIT, from Express Freight, is the first tool of its kind that allows carriers to use data to quickly identify the most favorable and competitive freight markets in the US.
All of our clients have access to in-depth dashboards on over 125 markets across the US and countless lanes between these markets.
Now, let’s see a snapshot of live data from this week to give you an upper hand as you plan your routes and negotiate rates. Contact us at 877.697.0605, if you’re interested in getting access to the full platform.
MarketFIT Platform Overview
Here is an overview of the MarketFIT platform provided by Dan Hadley, CEO of Express Freight Finance.
If it’s your first time here, we encourage you to have a watch to see how powerful this data can be when you put it to work inside your business.
This Midwest City Has Been Gaining Strong Upward Momentum, And Could Grab The Lead From Reigning Champion, Cedar Rapids.
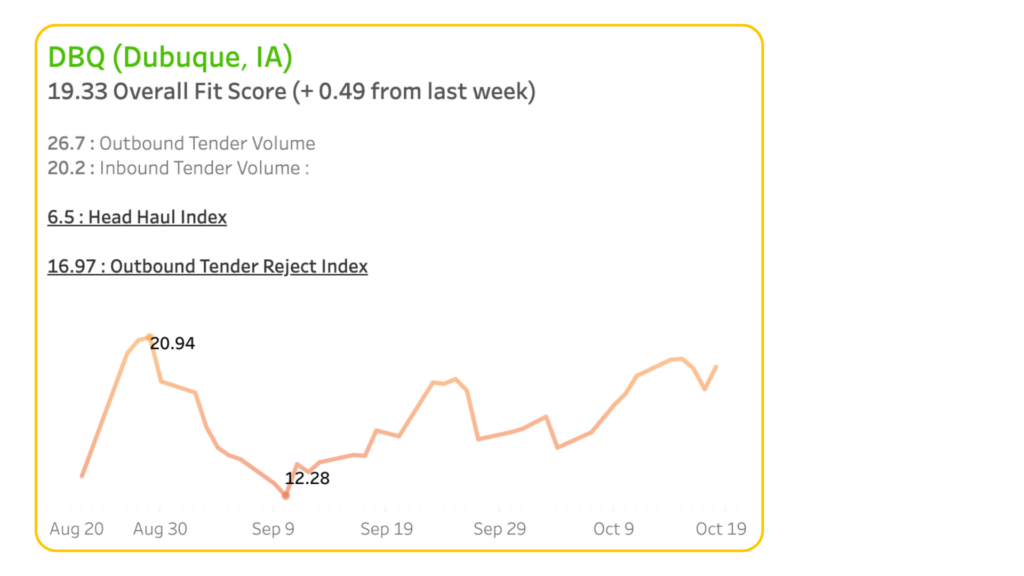
Although it wrestled with some turbulence in early September, Dubuque, Iowa has reached its highest point in the last eight weeks, with its Overall Fit Score currently sitting at 19.33 (up 0.49 from last week).
If Dubuque stays on this current trend, it could reclaim its highest Fit score of 20.94, which it achieved back in August.
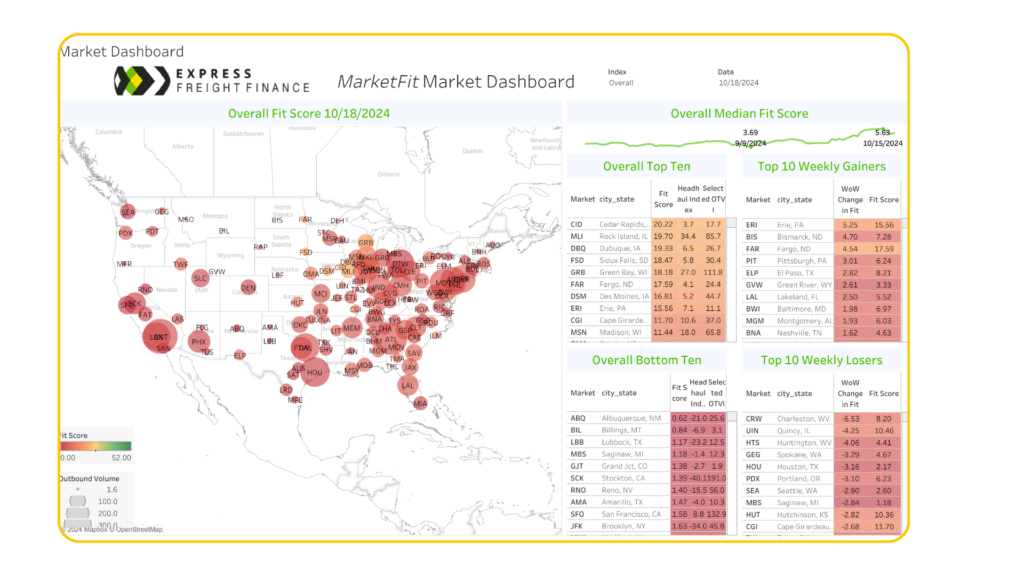
Currently, Dubuque is riding in third place, behind Rock Island, Illinois in second, and our champion, Cedar Rapids.
Now, if Dubuque can hold the line, we could very well crown a new MarketFIT leader.
It’s also worth mentioning that Erie, Pennsylvania and Bismarck, North Dakota were two of our highest weekly gainers, in addition to Fargo, North Dakota.
We’ll evaluate their performance and see if they can pull it off again next week.
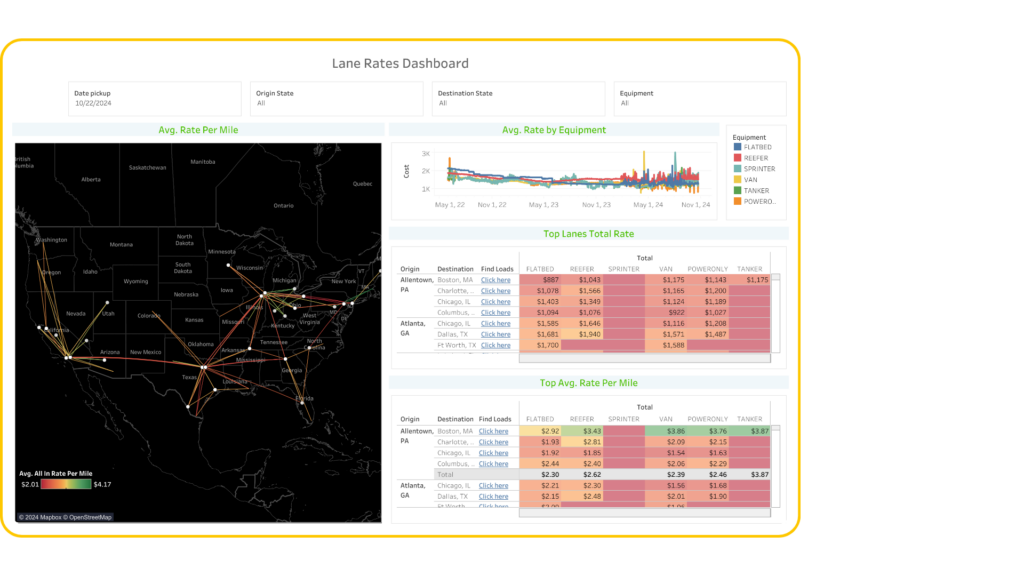
Carriers Continue To Ramp Up Profits With These Lanes.
- Allentown, PA – Boston, MA – Avg. Rate per Mile: $4.17
- Chicago, IL – Detroit, MI – Avg. Rate per Mile: $3.71
- Ontario, CA – Phoenix, AZ – Avg. Rate per Mile: $3.70
Let’s see if they can hold on to their hot streak during peak season.
We do the heavy lifting by fueling you with the most accurate real-time market data so that you can always pack your pipeline with the highest profitable loads to boost revenue and scale your business in any type of market.
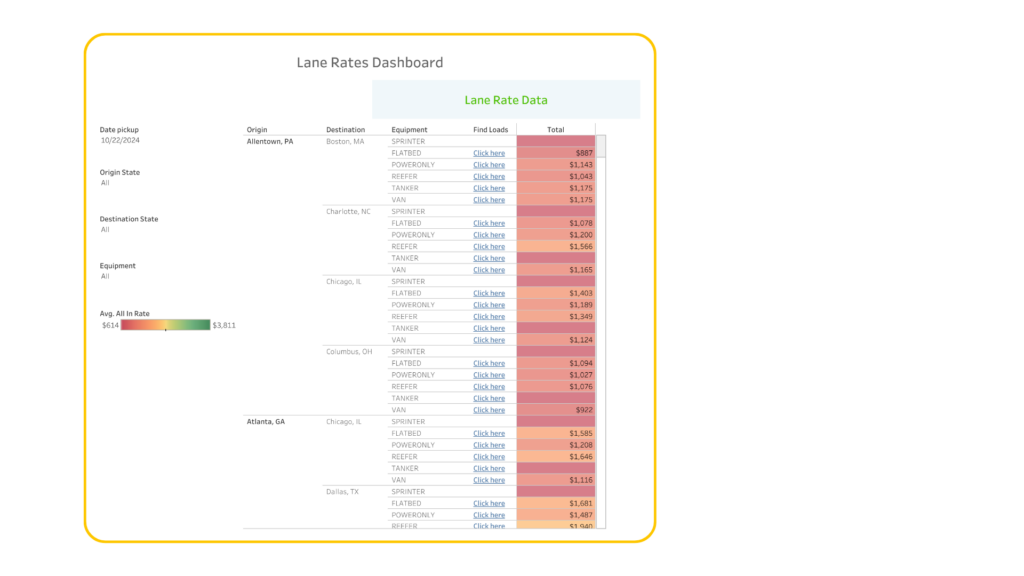
Load Availability & Lane Rates Dashboard
Available to all of our clients is a load board integrated directly into MarketFIT that not only shows you the rates but also helps you find the best available loads quickly.
Below is a highlight of what that data looks like across key markets.
We have data in MarketFIT on 135 critical markets across the entire United States.
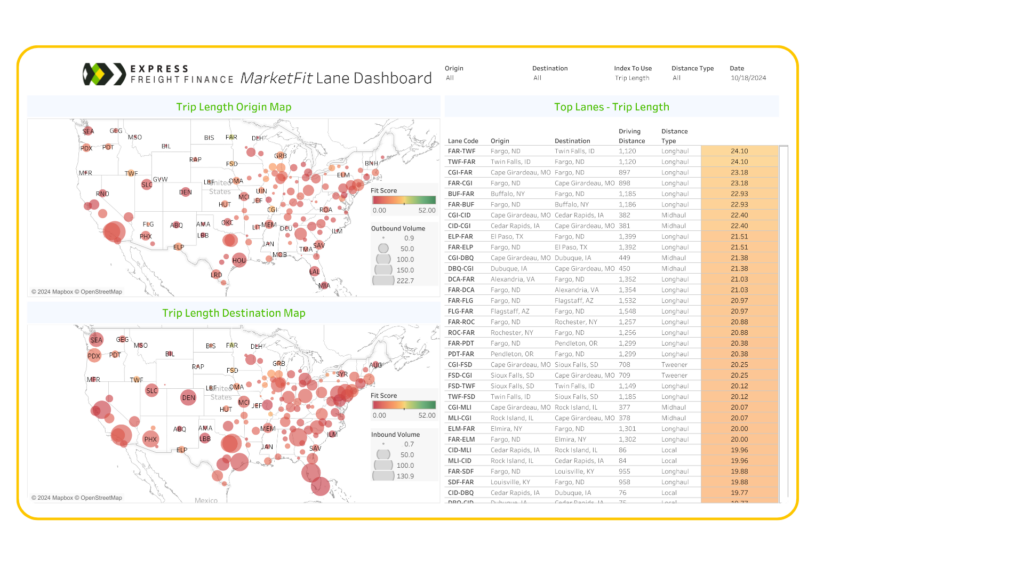
You can learn more about MarketFIT and request a demo by visiting MarketFIT.