
MarketFIT, from Express Freight, is the first tool of its kind that allows carriers to use data to quickly identify the most favorable and competitive freight markets in the US.
All of our clients have access to in-depth dashboards on over 125 markets across the US and countless lanes between these markets.
Now, let’s see a snapshot of live data from this week to give you an upper hand as you plan your routes and negotiate rates. Contact us at 877.697.0605, if you’re interested in getting access to the full platform.
MarketFIT Platform Overview
Here is an overview of the MarketFIT platform provided by Dan Hadley, CEO of Express Freight Finance.
If it’s your first time here, we encourage you to have a watch to see how powerful this data can be when you put it to work inside your business.
Market Highlight: Twin Falls, ID
Against overall week lows, Twin Falls, ID tops with an overall FIT Score of +40.61 and–although it is down 4.86 from last week–we are seeing exceptionally high numbers in relation to Outbound & Inbound Tender Volume as well as a whopping 46.6 Head Haul Index. TWF’s score spike signals a strengthening market at the close of Q4 into the early beginnings of Q1. Explore crucial map updates for key insights into this week’s changing market trends.
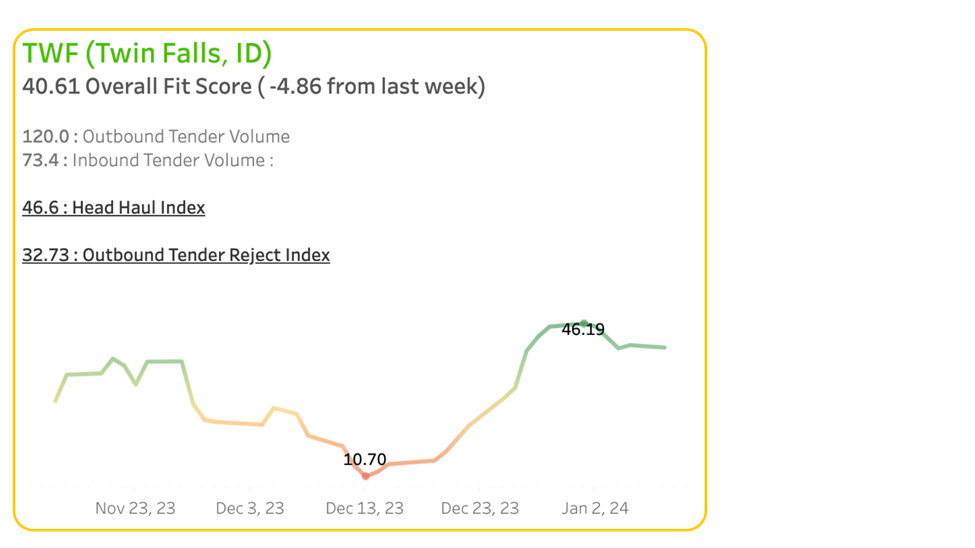
What this means for carriers
- Trucks heading to Twin Falls might find it easier to secure inbound freight, as the current volume of inbound tenders exceeds the outbound freight in this area.
- Contracted freight, despite facing rejection rates above national averages, is presenting promising opportunities for available freight in the short-term spot market.
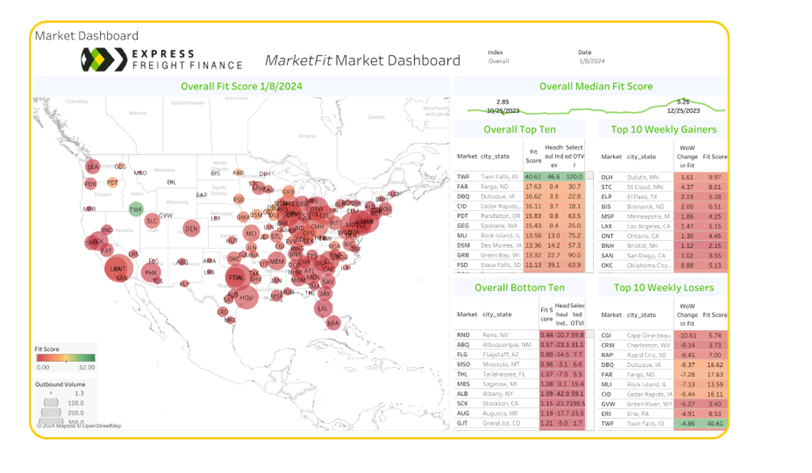
Market Snapshot: Peak Season Highs Begin To Taper In Q1
This week, we’re seeing the overall market up from recent highs a few weeks ago.
The US MarketFIT score, sitting at 3.40 is continuing on towards a plateauing trend, reflecting the closing of the bustling Q4 surge—much to be expected as we head into Q1. We will be curious to see how this market lays as early 2024 commences.
We will be watching this number closely as we continue into Q1 to see how it moves over the next few weeks.
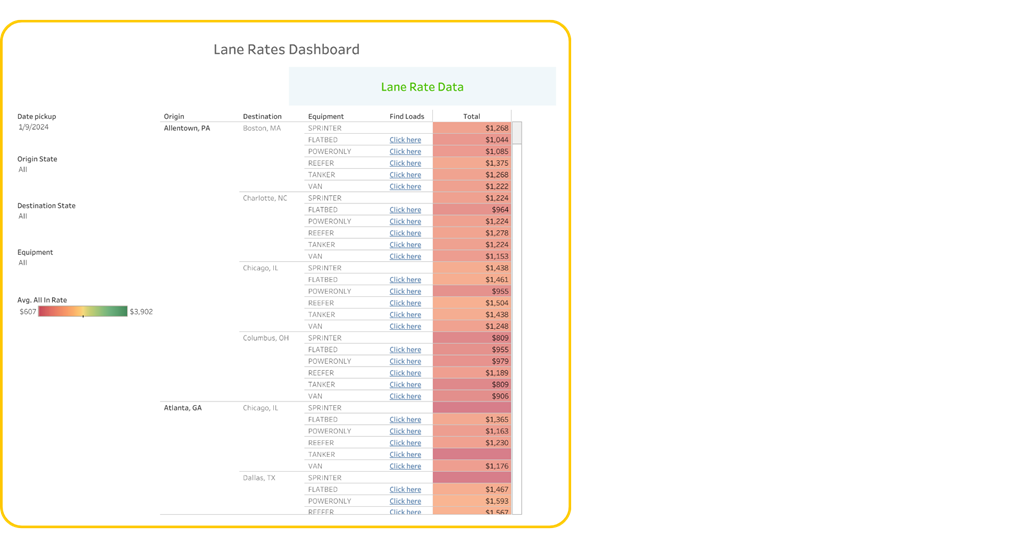
Lane Rates: Lane Rates Continue To Spike In Key Areas
Similar to last week, the Lane Rates Dashboard indicates a surge in activity, gearing up for the latter portion of peak season. The Southern California, Texas, and North East regions continue to display noteworthy levels of activity, while the Northwestern parts of the U.S. remain quiet. These areas appear to be booming with activity as we enter Q1.
For carriers navigating routes heading Southwest or Northeast this week, there’s a promising outlook with slightly improved rates anticipated in key lanes. This uptick suggests potential opportunities for better returns on these routes during this period.
We’ll keep an eye out to determine if these key markets continue to move and how they shift in early Q1.

Load Availability & Lane Rates Dashboard
Available to all of our clients is a load board integrated directly into MarketFIT that not only shows you the rates but also helps you find the best available loads quickly.
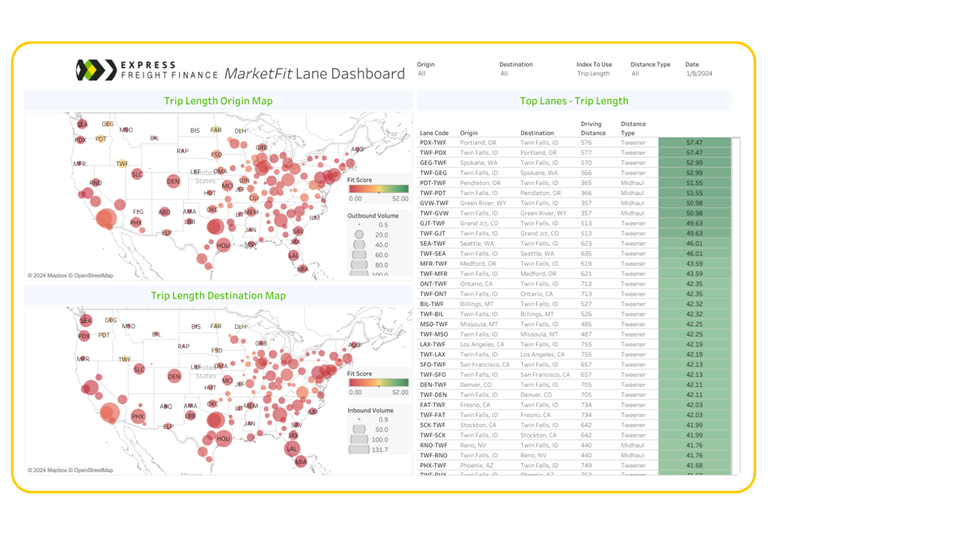
Below is a highlight of what that data looks like across key markets.
We have data in MarketFIT on 135 critical markets across the entire United States.
You can learn more about MarketFIT and request a demo by visiting MarketFIT.