MarketFIT, from Express Freight, is the first tool of its kind that allows carriers to use data to quickly identify the most favorable and competitive freight markets in the US.
All of our clients have access to in-depth dashboards on over 125 markets across the US and countless lanes between these markets.
Now, let’s see a snapshot of live data from this week to give you an upper hand as you plan your routes and negotiate rates. Contact us at 877.697.0605, if you’re interested in getting access to the full platform.
MarketFIT Platform Overview
Here is an overview of the MarketFIT platform provided by Dan Hadley, CEO of Express Freight Finance.
If it’s your first time here, we encourage you to have a watch to see how powerful this data can be when you put it to work inside your business.
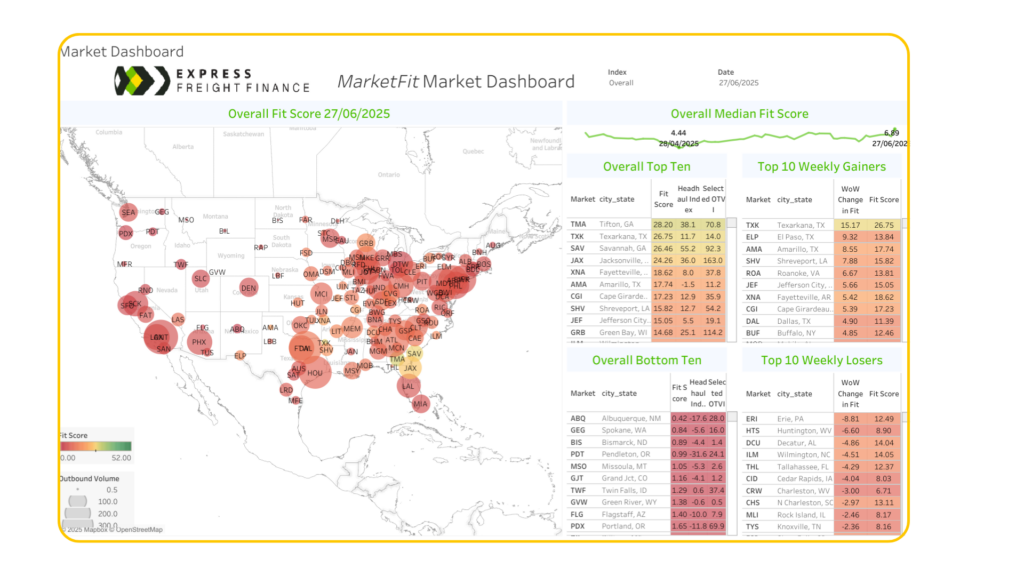
Amarillo, TX delivers a significant performance boost this week, gaining 8.55 points to reach an Overall Fit Score of 17.74.

Outbound Tender Volume is relatively low at 11.2, while Inbound Tender Volume exceeds it at 12.7. This imbalance results in a negative Head Haul Index of -1.5, suggesting Amarillo is more of a destination than an origin point for freight. This can challenge carriers looking for outbound loads, as they may face difficulties repositioning efficiently from this market.
The Outbound Tender Reject Index (OTRI) is at 18.95, significantly higher than earlier in the month (as low as 4.91 in early May). This surge implies that carriers are increasingly declining contracted freight offers, likely due to tightening truck availability or more lucrative opportunities in the spot market. Elevated rejections may lead to rate inflation and greater volatility.
Despite the imbalance in freight flows, Amarillo’s sharp rise in rejections and improved Fit Score reflect tightening conditions. This market’s elevated OTRI could present opportunities for rate adjustments and spot market penetration. However, the lack of head haul advantage means routing strategies must account for potential inefficiencies in repositioning assets.
Carriers Continue To Ramp Up Profits With These Lanes:
- Allentown, PA – Boston, MA – Avg. Rate per Mile: $4.16
- Joliet, IL – Cincinnati, OH – Avg. Rate per Mile: $3.41
- Los Angeles, CA – Dallas, TX – Avg. Rate per Mile: $2.29
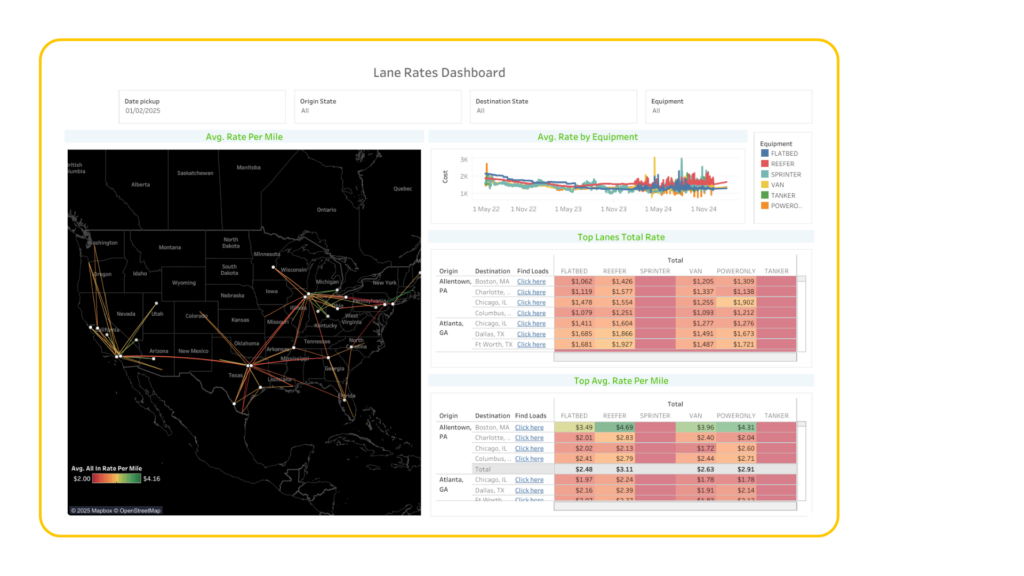
Load Availability & Lane Rates Dashboard
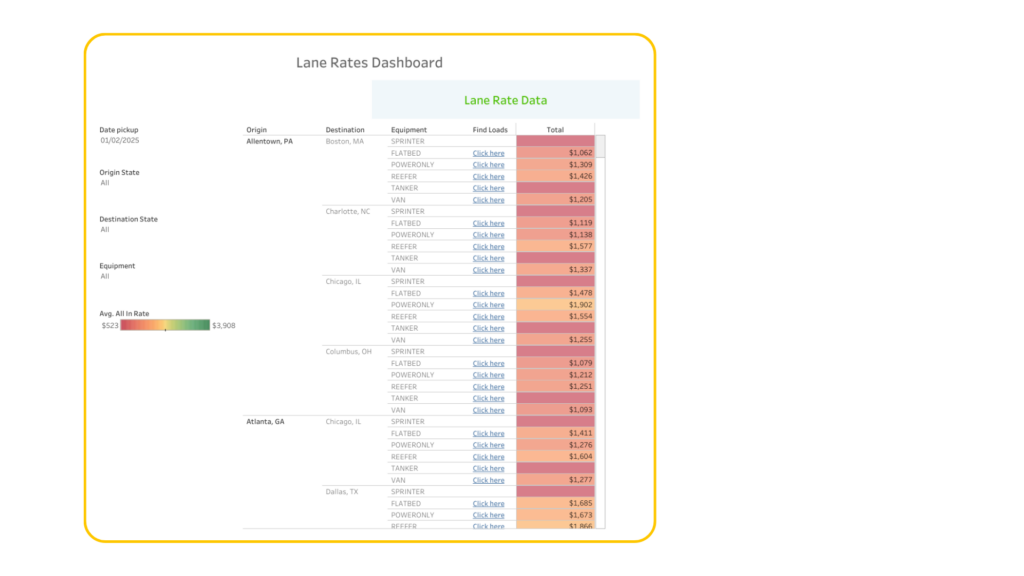
Available to all of our clients is a load board integrated directly into MarketFIT that not only shows you the rates but also helps you find the best available loads quickly.
Below is a highlight of what that data looks like across key markets.
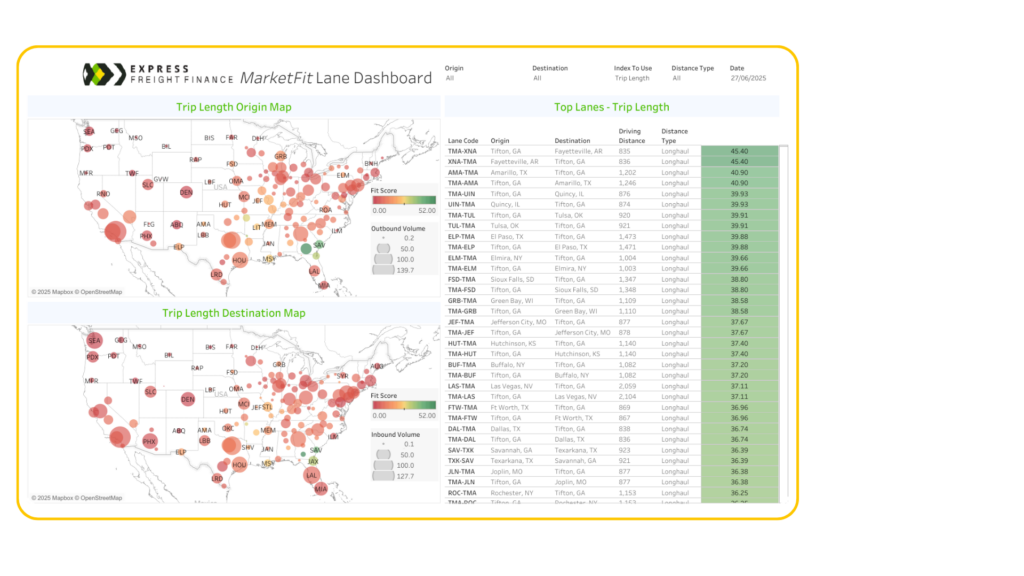
We have data in MarketFIT on 135 critical markets across the entire United States.
You can learn more about MarketFIT and request a demo by visiting MarketFIT.