
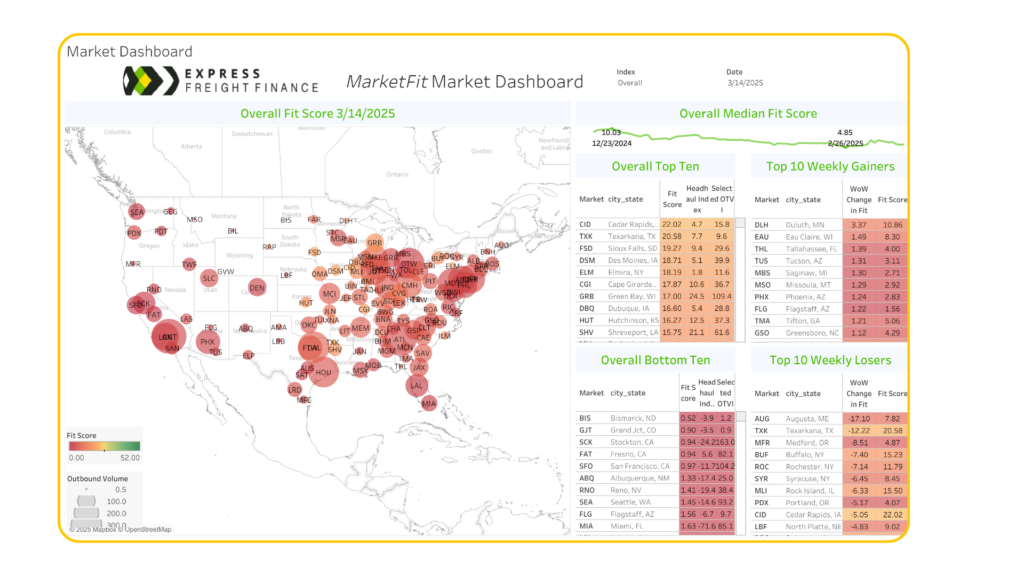
MarketFIT, from Express Freight, is the first tool of its kind that allows carriers to use data to quickly identify the most favorable and competitive freight markets in the US.
All of our clients have access to in-depth dashboards on over 125 markets across the US and countless lanes between these markets.
Now, let’s see a snapshot of live data from this week to give you an upper hand as you plan your routes and negotiate rates. Contact us at 877.697.0605, if you’re interested in getting access to the full platform.
MarketFIT Platform Overview
Here is an overview of the MarketFIT platform provided by Dan Hadley, CEO of Express Freight Finance.
If it’s your first time here, we encourage you to have a watch to see how powerful this data can be when you put it to work inside your business.
With a steady increase in its Fit Score, Shreveport, LA maintains its momentum as a market to watch, and is part of the Overall Top Ten
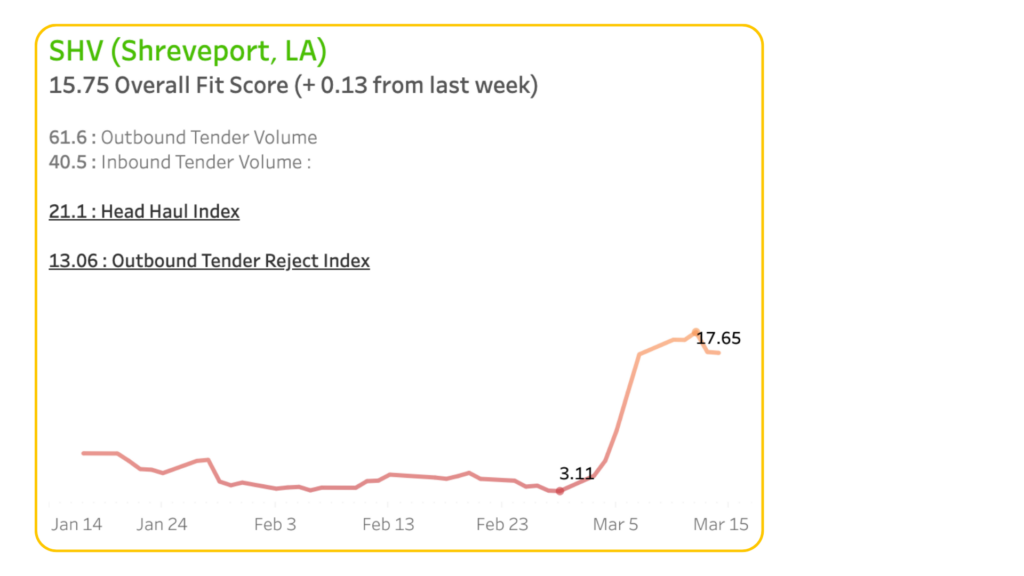
Shreveport’s Overall Fit Score now stands at 15.75, marking a slight but consistent increase of 0.13 points from last week. This growth continues the upward trajectory observed in recent weeks, reinforcing the market’s steady rise.
Previously, Shreveport’s Fit Score saw a sharp increase, climbing from 3.11 to 17.65, signaling a significant shift in market activity. Although this week’s growth is more modest, key metrics indicate that the market remains strong. The Head Haul Index is now at 21.1, and the Outbound Tender Reject Index has reached 13.06, both showing stable demand and ongoing movement in freight activity.
As Shreveport maintains this positive trend, the market’s development will be closely monitored in the coming weeks to determine if this momentum can sustain and further solidify its presence as an emerging force in the region.
Carriers Continue To Ramp Up Profits With These Lanes:
- Augusta, ME – Elizabeth, NJ – Avg. Rate per Mile: $3.05
- Stockton, CA – Portland, OR – Avg. Rate per Mile: $2.83
- Los Angeles, CA – Ft Worth, TX – Avg. Rate per Mile: $2.33
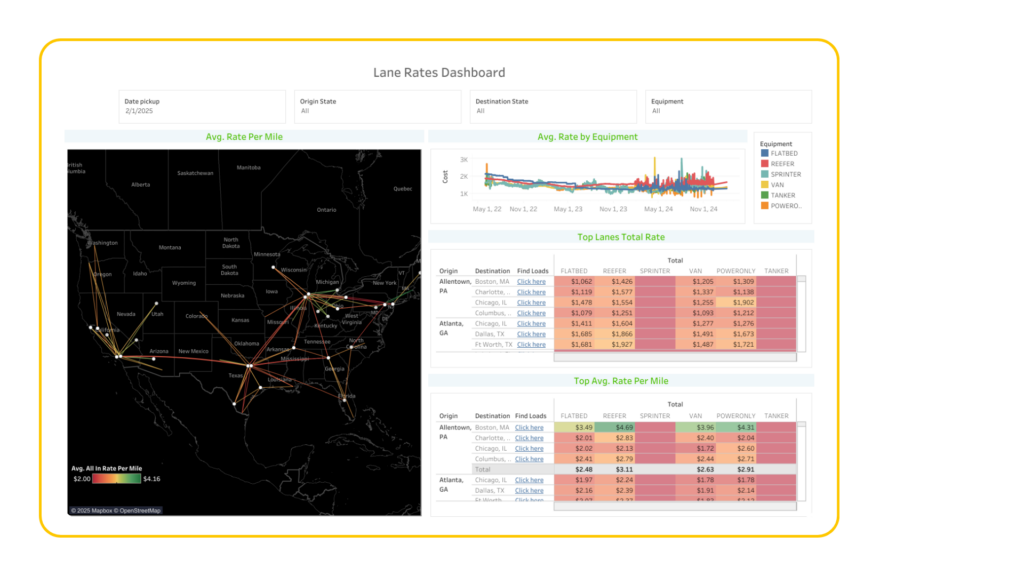
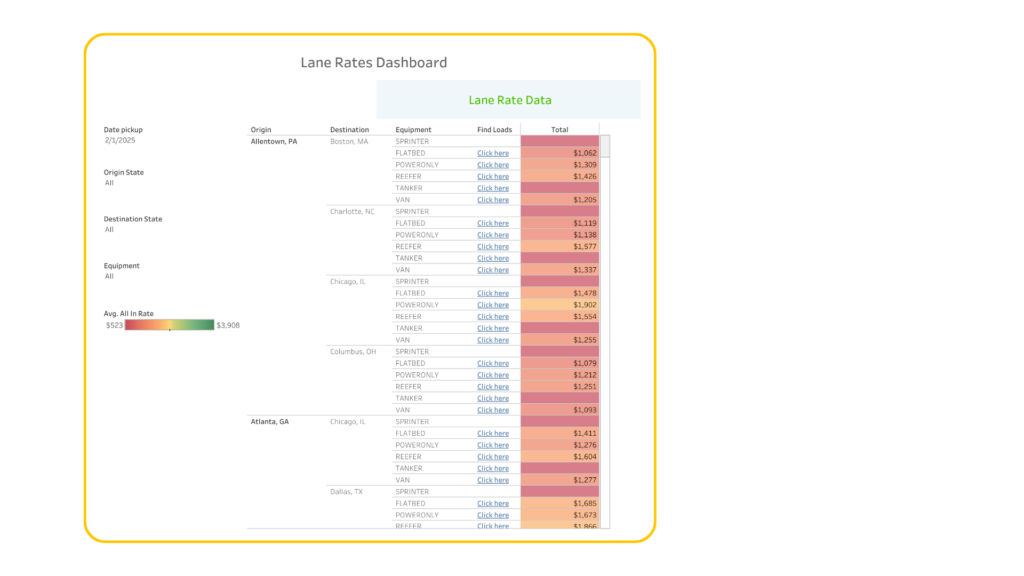
Load Availability & Lane Rates Dashboard
Available to all of our clients is a load board integrated directly into MarketFIT that not only shows you the rates but also helps you find the best available loads quickly.
Below is a highlight of what that data looks like across key markets.
We have data in MarketFIT on 135 critical markets across the entire United States.
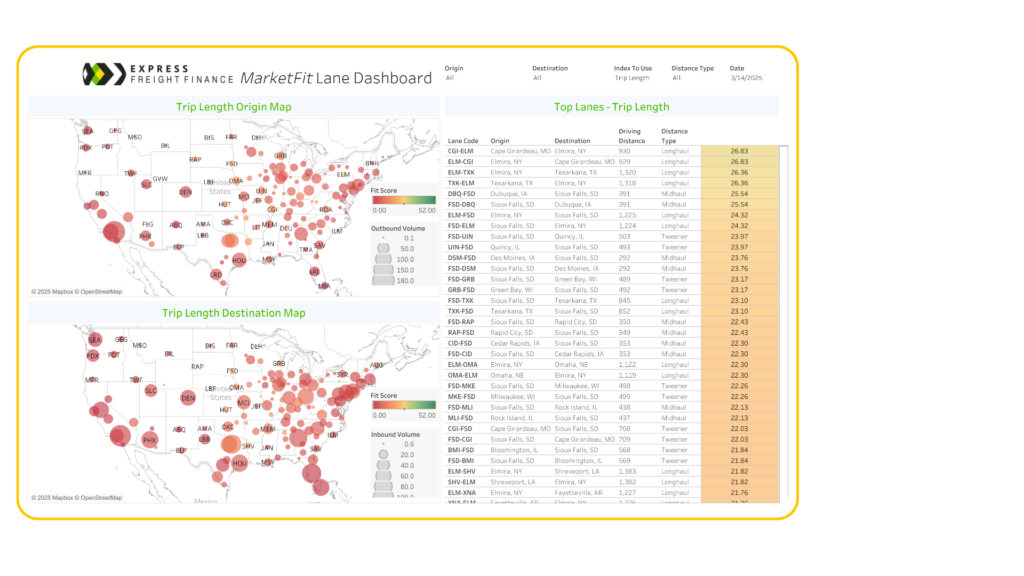
You can learn more about MarketFIT and request a demo by visiting MarketFIT.