
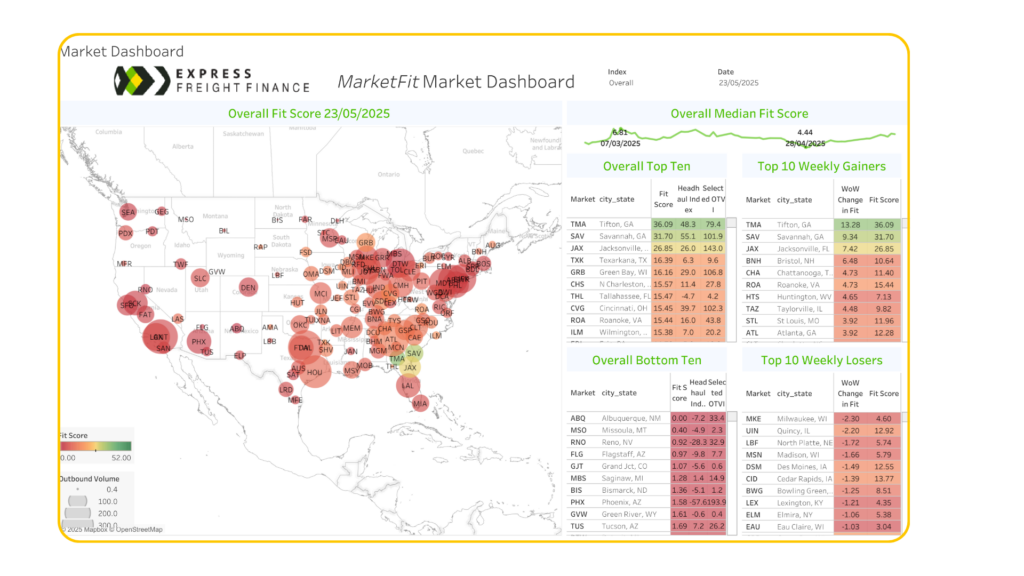
MarketFIT, from Express Freight, is the first tool of its kind that allows carriers to use data to quickly identify the most favorable and competitive freight markets in the US.
All of our clients have access to in-depth dashboards on over 125 markets across the US and countless lanes between these markets.
Now, let’s see a snapshot of live data from this week to give you an upper hand as you plan your routes and negotiate rates. Contact us at 877.697.0605, if you’re interested in getting access to the full platform.
MarketFIT Platform Overview
Here is an overview of the MarketFIT platform provided by Dan Hadley, CEO of Express Freight Finance.
If it’s your first time here, we encourage you to have a watch to see how powerful this data can be when you put it to work inside your business.
With an increase of 4.73 points, Roanoke, VA is showing signs of renewed market strength, climbing to an Overall Fit Score of 15.44.
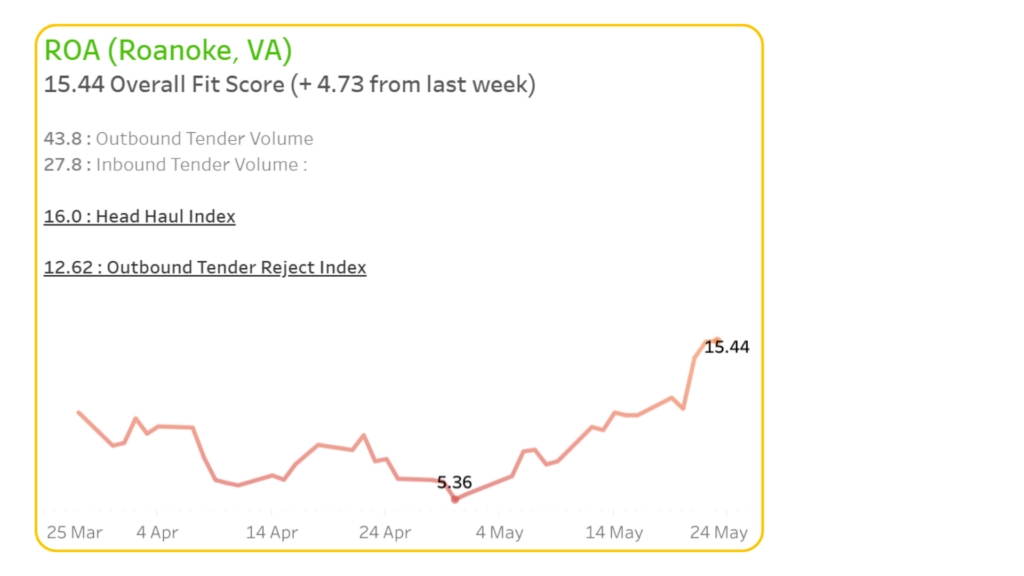
After bottoming out at a score of just 5.36 in early May, Roanoke’s freight dynamics have shifted notably upward. The Outbound Tender Reject Index has surged to 12.62, indicating growing reluctance among carriers to accept contract freight. This uptick in rejections is often a precursor to tighter capacity and upward pressure on spot rates. Meanwhile, the Head Haul Index remains positive at 16.0, confirming Roanoke as a net outbound market with more freight leaving than entering.
Current freight volumes reflect a stable environment for outbound demand. Outbound Tender Volume stands at 43.8, significantly higher than the inbound figure of 27.8. This imbalance continues to support Roanoke’s role as an attractive origin market for carriers. The recent upward spike in the fit score, especially over the last two weeks of May, suggests a shift in market sentiment and a possible tightening trend that could impact pricing and planning.
As this rebound gains momentum, logistics planners and shippers should monitor Roanoke closely. If rejection rates remain elevated and volume trends hold, the region may face constrained capacity and rising volatility—making it a strategic market to watch for routing decisions and rate negotiations.
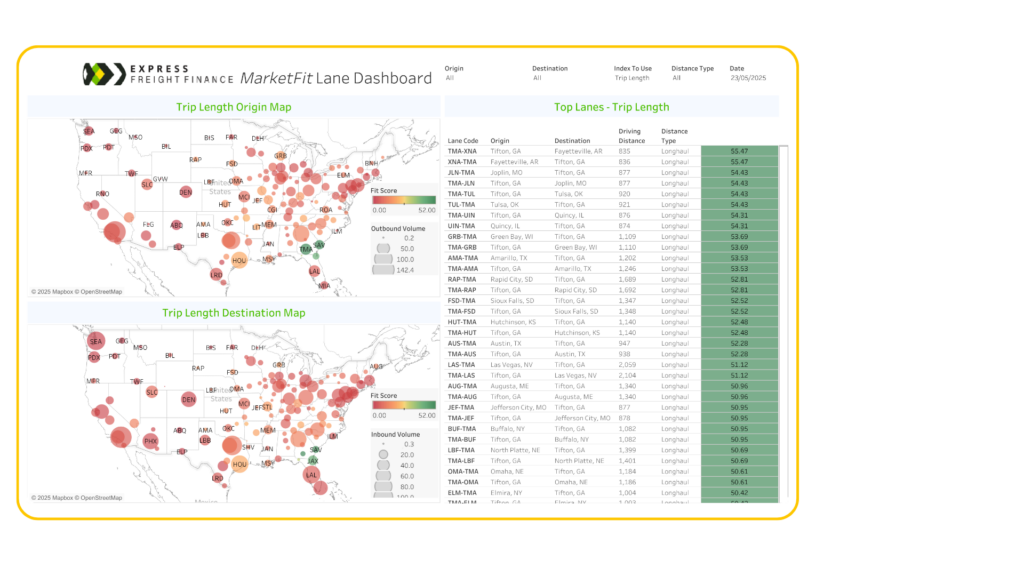
Carriers Continue To Ramp Up Profits With These Lanes:
- Allentown, PA – Boston, MA – Avg. Rate per Mile: $4.16
- Los Angeles, CA – Salt Lake City, UT – Avg. Rate per Mile: $3.14
- Dallas, TX – Lakeland, FL – Avg. Rate per Mile: $2.49

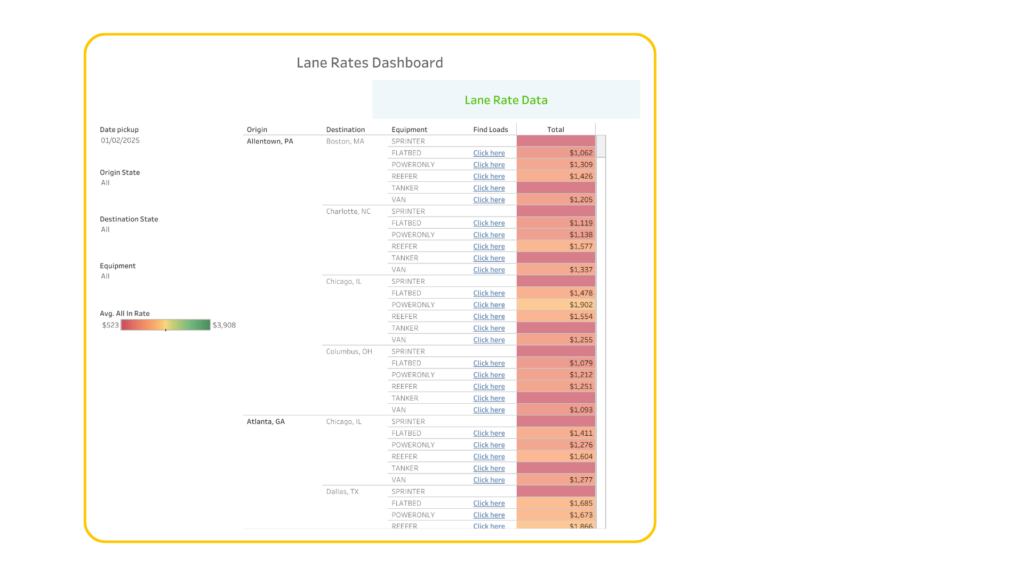
Load Availability & Lane Rates Dashboard
Available to all of our clients is a load board integrated directly into MarketFIT that not only shows you the rates but also helps you find the best available loads quickly.
Below is a highlight of what that data looks like across key markets.
We have data in MarketFIT on 135 critical markets across the entire United States.
You can learn more about MarketFIT and request a demo by visiting MarketFIT.